In 2015, Homejoy shut down. The on-demand home cleaning startup had raised $38 million, achieved real revenue, and expanded to 30 cities. From the outside, the story looked like a legal problem — a worker misclassification lawsuit that made the unit economics untenable. But the lawsuit was a symptom. The actual disease had been visible for years in a metric nobody was watching closely enough: the cost to acquire a customer versus what that customer was worth over their lifetime.
Homejoy’s CAC was high. Acquisition ran through deep discount codes, sometimes offering a first clean for $19. Customers tried the service, liked it, and then did what rational humans do: they found the cleaner they liked and hired her directly, cutting out Homejoy entirely. The company was spending aggressively to acquire customers who had strong incentive to churn. Burn rate looked like growth. It was actually a transfer of value from investors to customers to independent contractors, with Homejoy skimming almost nothing on the way through.
Every board deck showed burn. Burn was the thing. And burn, as a number, told almost none of the real story.
The Problem With Burn Rate As a Primary Metric
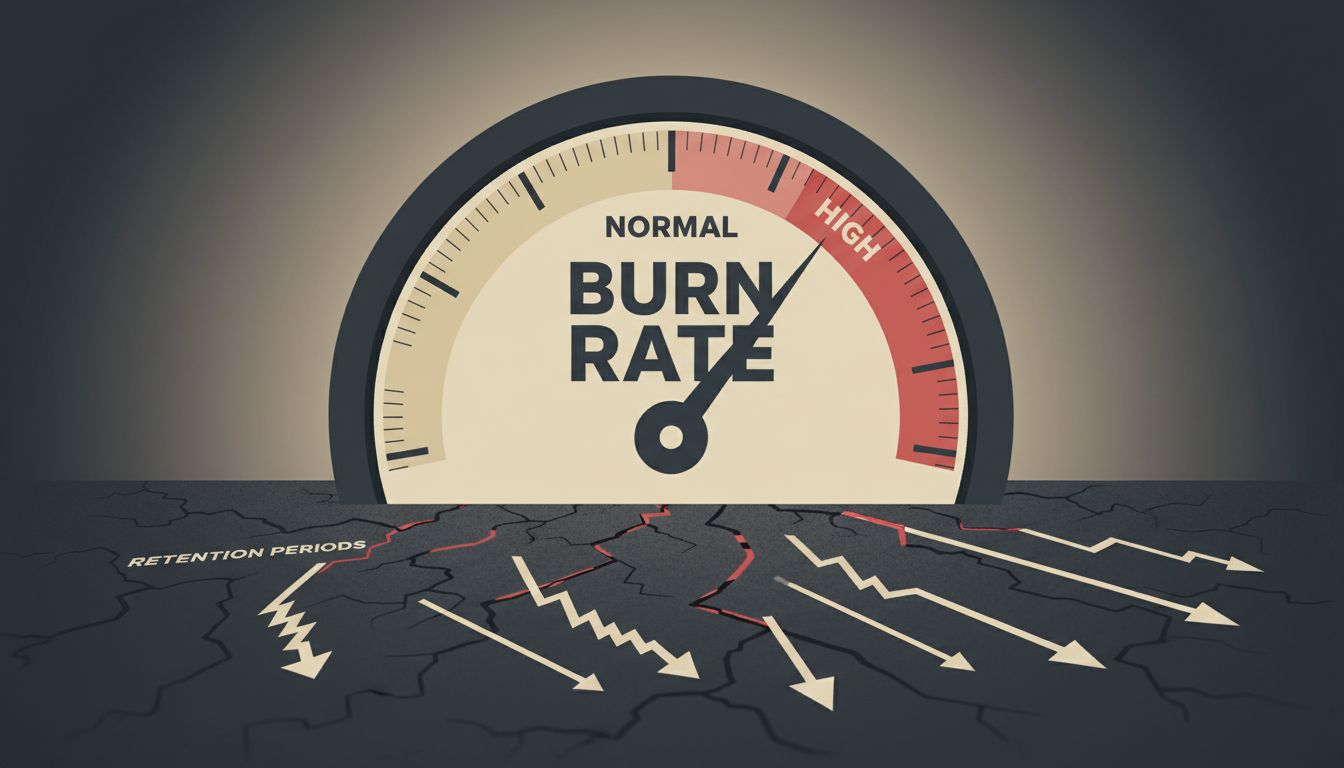
Burn rate answers exactly one question: how long until you run out of money at your current pace? That question matters. It’s not useless. But it’s a lagging indicator masquerading as a leading one, and watching it closely gives founders the feeling of financial rigor without most of the substance.
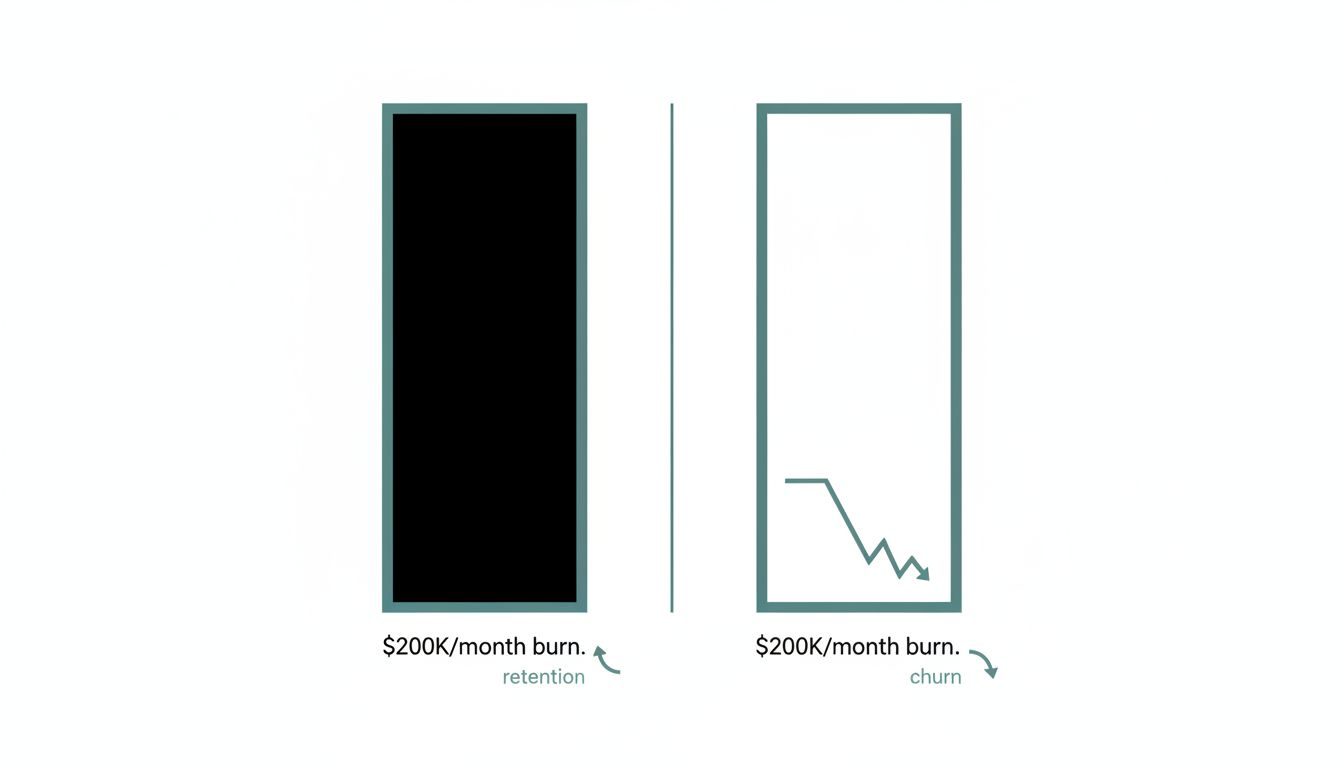
Here’s what burn rate doesn’t tell you: whether the money you’re spending is building anything durable. A company burning $200K a month acquiring customers with 18-month payback periods in a market with 40% annual churn is in a fundamentally different position than a company burning $200K a month with 6-month payback and 90% net revenue retention. Same number. Opposite trajectories.
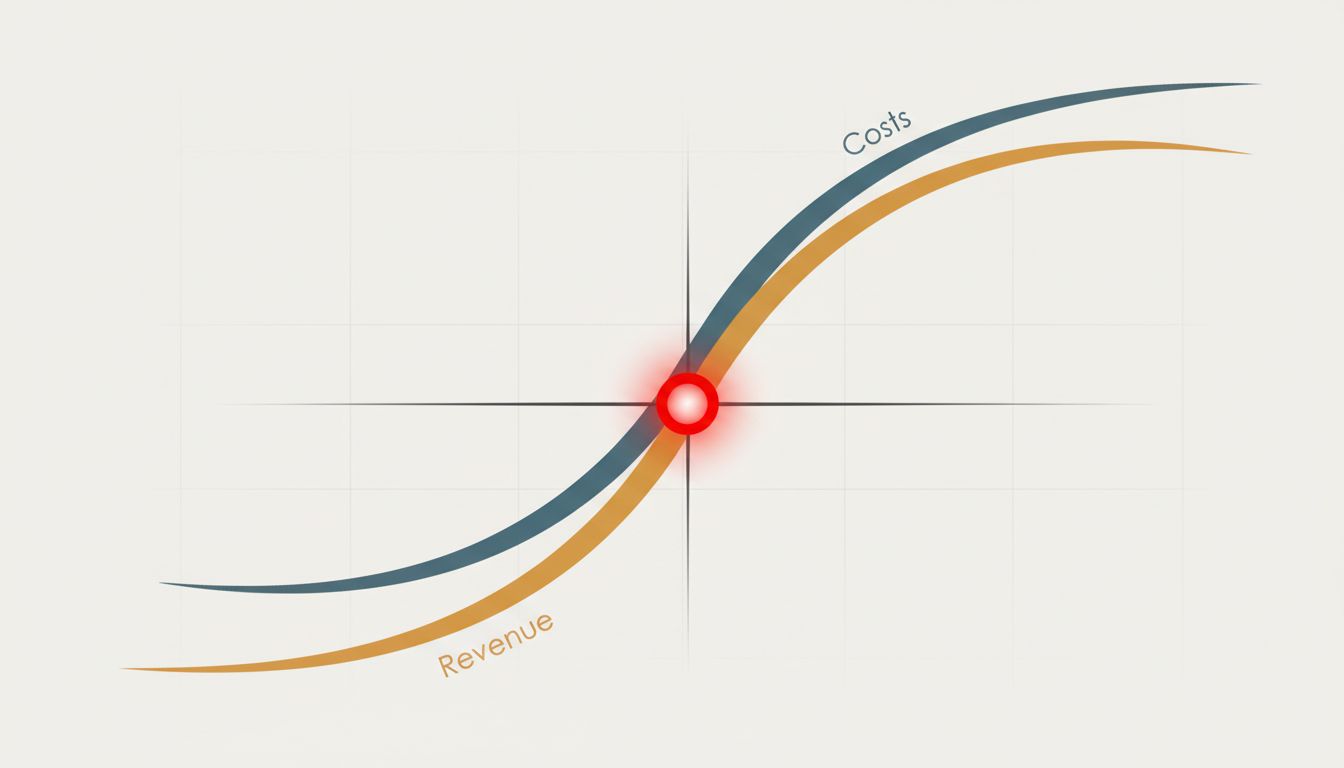
The metric that actually predicts whether a startup survives its next 24 months isn’t how fast money leaves the bank. It’s the ratio between what each dollar of spend is building (measured in retained, expanding customer value) and what that dollar costs. Call it capital efficiency. Call it burn multiple, which is the term Bessemer Venture Partners has formalized as net burn divided by net new ARR. Whatever you call it, it’s asking a harder, better question: for every dollar we spend, how much durable revenue are we creating?
Homejoy’s burn multiple, if anyone had been tracking it rigorously, would have looked alarming long before the lawsuits materialized. They were spending heavily. New ARR was accumulating slowly because churn was high. The ratio was bad and getting worse as they scaled into new cities and repeated the same acquisition-and-defection pattern at greater expense.
What Watching Burn Causes You to Optimize For
The insidious thing about burn rate as a primary metric is the behavior it incentivizes. If your job is to make the burn number look manageable, you cut costs. You hire slowly. You delay that marketing spend. These are sometimes the right calls. But they’re just as often ways to avoid the harder question, which is whether the spending you’re doing is working at all.
I’ve watched founders negotiate cloud infrastructure costs down to the bone while their sales team was closing deals with a customer segment that would never expand, renew at lower rates, and require expensive support. The infrastructure savings were real. The customer economics were a slow disaster. Because burn was the thing everyone watched, the infrastructure conversation got airtime and the customer mix conversation didn’t.
This is related to a broader problem in startup metrics hygiene: we optimize for what’s easy to measure and legible to outsiders. Burn is easy. You can read it off a bank statement. Capital efficiency requires you to know your churn, your expansion revenue, your payback period by cohort, and the honest answer to whether what you’re building compounds or decays. Most founders know their burn number to the dollar. Many couldn’t tell you their net revenue retention within 10 percentage points.
The Metric Stack That Actually Matters
This isn’t an argument that burn rate is irrelevant. Runway determines whether you live long enough to fix your problems. But it should be the third or fourth thing you look at, not the first.
The stack, in rough order of importance for a growth-stage SaaS or marketplace company:
Net revenue retention. If your existing customers are expanding, you have a compounding business. If they’re shrinking, you’re on a treadmill that gets harder to run as it speeds up. Anything above 100% means your base grows even with zero new sales. Anything below 90% means you’re leaking.
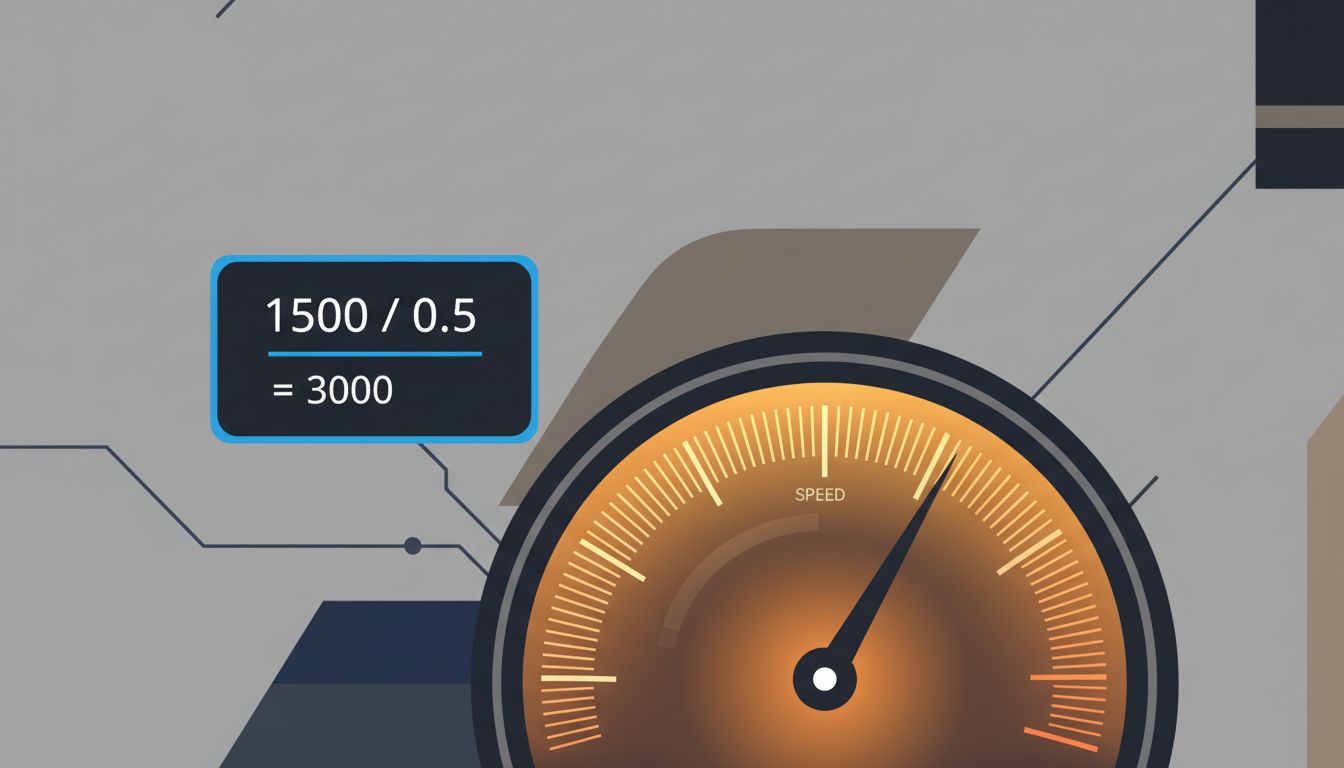
Payback period by acquisition channel. Not blended. By channel. Your organic payback might be 4 months. Your paid social might be 22 months. Blended looks fine. The growth you’re investing in is the 22-month variety.
Burn multiple. Net burn divided by net new ARR. Below 1x is excellent. Above 2x means you’re spending a lot to grow a little. Above 3x in a flat or contracting market is a serious problem dressed up as a growth story.
Then burn rate. Because yes, you need to know how long the runway is. You just need to know the other things first.
Homejoy never got to fix its unit economics because it scaled before validating them. By the time the churn pattern was undeniable, they’d expanded to 30 cities and needed the revenue from all of them to justify the cost structure they’d built. Cutting back wasn’t really an option. The lawsuit gave them a reason to close that felt external, but the economics had been pointing this direction for a while.
There’s a version of this story where someone in a board meeting in 2013 says: our retention is bad and our payback period depends on customers not realizing they can hire our cleaners directly. That’s not a legal problem. That’s a business model problem. And if that conversation had happened, and if it had been taken seriously, Homejoy either figures out a product that creates stickiness (think what Handy tried to do with vetted, insured pros and trust as the product) or it doesn’t raise $38 million and expand to 30 cities. Both outcomes are better than the one that happened.
Burn rate told everyone the company was alive. The real metrics would have told them what it was spending its life on.
Watch the right numbers. Burn tells you when the clock runs out. Capital efficiency tells you whether any of it was worth the time.