In 2015, the Facebook mobile team faced a problem that should not have existed. Their internal benchmarks showed the iOS app loading feed content in well under a second. Their engineers had spent months optimizing database queries, compressing images, and tuning network requests. On paper, the app was fast. Users, consistently, said it felt sluggish.
The engineers were not lying. Neither were the users. They were measuring different things.
The Setup
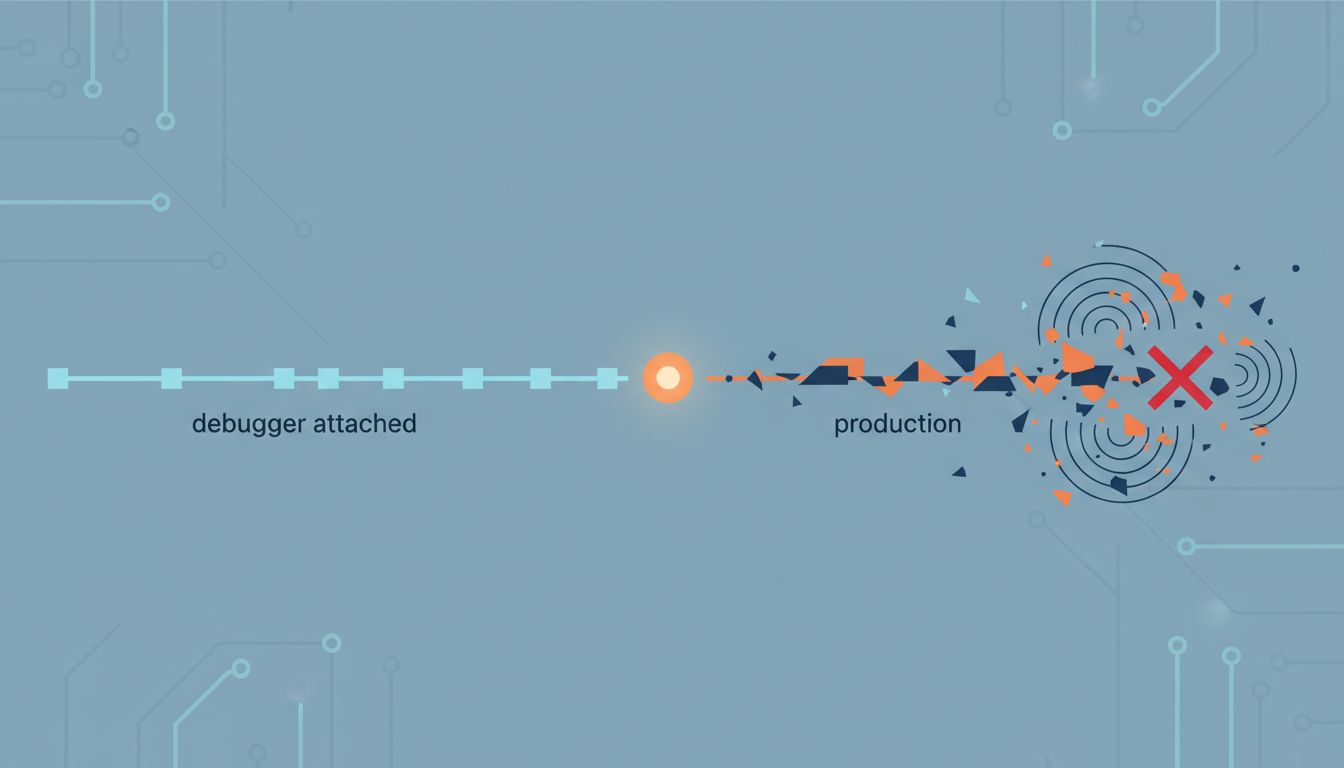
The Facebook team was measuring what engineers call throughput: how quickly the system could complete a defined task in a controlled environment. They ran tests on office Wi-Fi, on freshly installed builds, on devices with no background activity. Every benchmark was real. Every number was accurate. And none of it predicted what a user in São Paulo on a crowded 3G network, with seventeen other apps running, actually experienced.
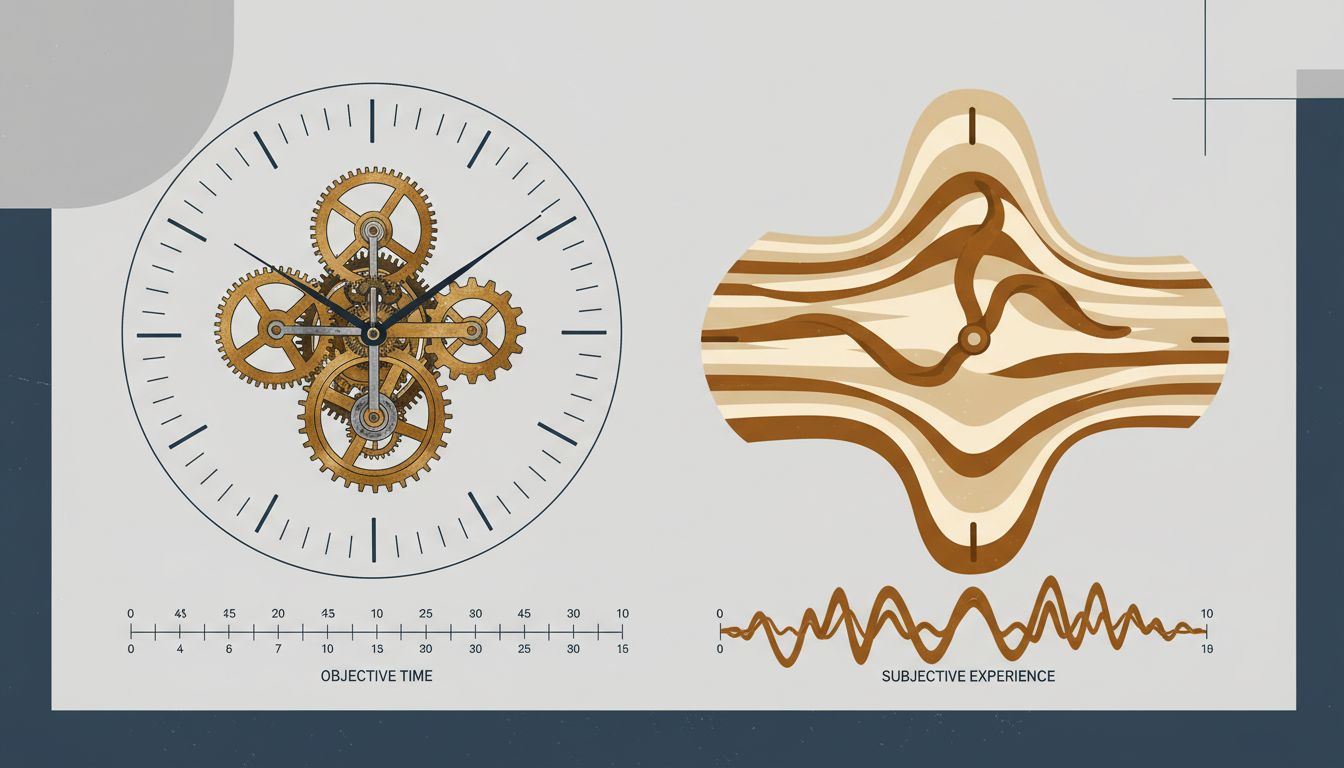
This is the core of the problem. Performance benchmarks measure the best plausible version of your software. Users experience the median version, or worse. The gap between those two things is not a measurement error. It is a measurement choice, and most teams make it badly.
The technical term for what users actually perceive is latency, but latency as experienced is more complicated than latency as measured. Human beings are remarkably sensitive to specific patterns of delay. Research in human-computer interaction has established for decades that users perceive a system as responsive if it acknowledges input within about 100 milliseconds, even if the actual result takes longer. A spinner that appears instantly feels faster than a blank screen followed by immediate content. The work is the same. The perception is completely different.
Facebook’s engineers were optimizing the wrong variable.
What Happened
The team introduced a concept they called perceived performance, distinct from actual performance. Instead of asking “how fast does this complete,” they started asking “how fast does this feel.” The difference forced a redesign of what they measured and when.
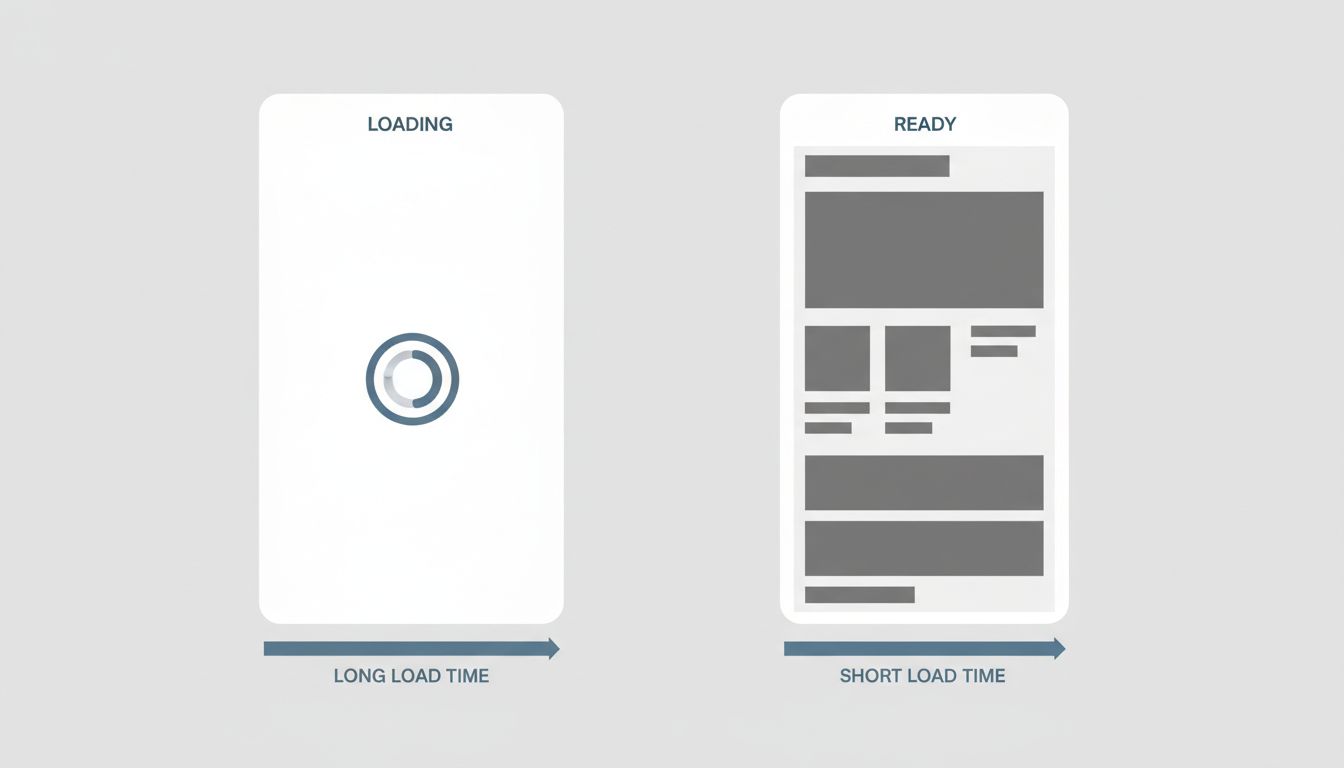
The most visible outcome was the skeleton screen, now ubiquitous across apps and websites. Rather than showing a spinner while content loaded, the app would instantly render gray placeholder shapes in the approximate layout of the incoming content. The actual load time did not change. Perceived load time dropped sharply. Users reported the app felt faster even in conditions where measured performance was identical.
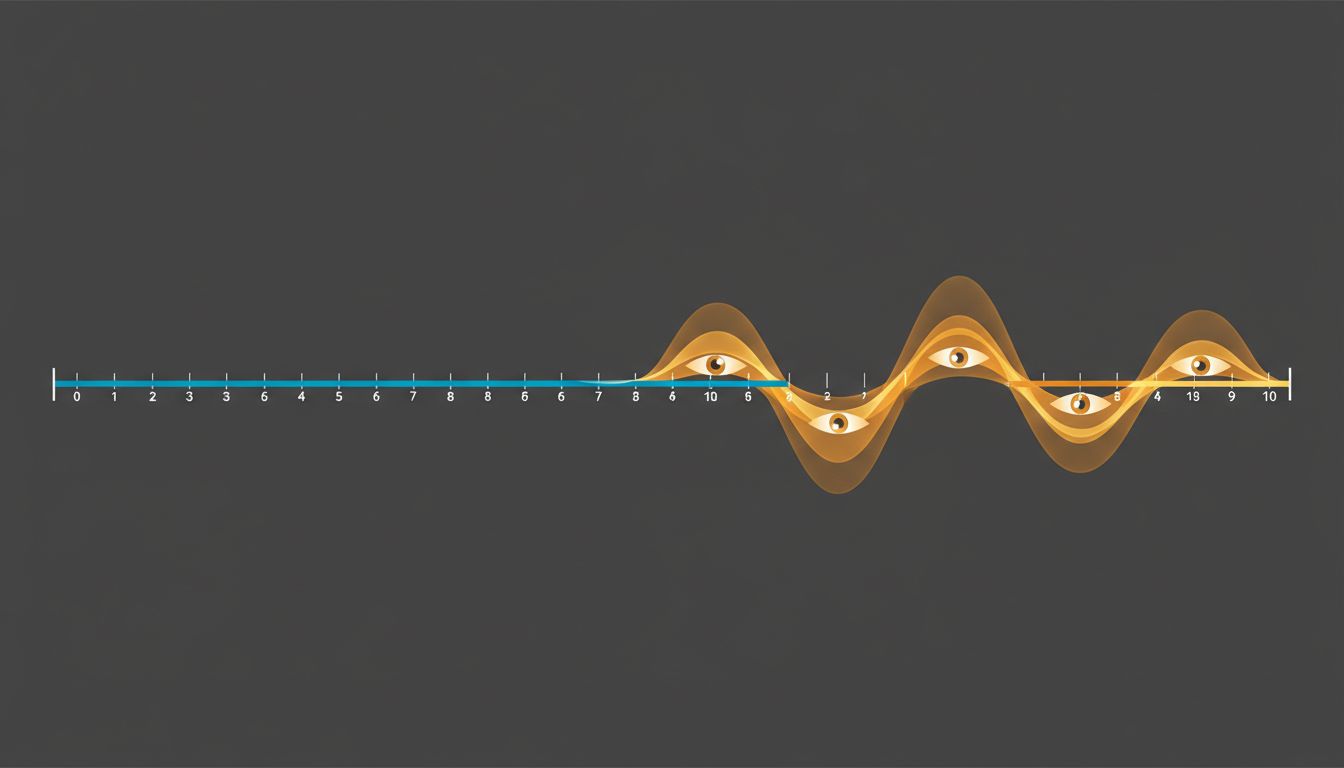
This was not a trick. It was an honest acknowledgment that human perception of speed is not linear and not purely about time-to-completion. Progress feels faster than waiting. A screen that looks like it is already mostly there feels faster than a blank screen that suddenly fills in. The engineers had optimized for a metric that did not map to user experience, and once they changed the metric, they could change the experience without touching the underlying infrastructure.
The second change was more technically demanding. The team began distinguishing between critical path rendering (the minimum needed to show something useful) and full completion (loading everything). They prioritized making the first visible content appear quickly, even if the complete state took longer. A user who sees their top story in 400 milliseconds and the rest of the feed in 1.2 seconds perceives a fast app. A user who waits 800 milliseconds for everything to appear at once perceives a slower one, even though the total data transferred was identical.
Why It Matters
This is not a Facebook-specific problem. It is a systemic failure in how the industry thinks about performance work.
Benchmarks are run by engineers in conditions optimized for repeatability. Repeatability requires controlling variables: consistent hardware, consistent network, isolated processes. Every one of those controls removes a factor that real users experience. The benchmark gets cleaner and less representative simultaneously.
There is also an incentive problem. Benchmarks produce numbers. Numbers go into sprint reviews, quarterly reports, and performance conversations. “We reduced average API response time by 40%” is a clean sentence. “We reduced the fraction of sessions where at least one interaction felt laggy” is harder to measure and harder to explain. Teams optimize for what they can report, not always for what users feel.
The result is a category of performance work that is genuinely difficult to prioritize: improvements that show up in user satisfaction and retention but not in benchmark dashboards. Companies often discover this gap only when a competitor’s product, with comparable or worse raw benchmarks, starts winning on user experience. The worse product sometimes wins because it got the feel right when the faster product got the metrics right.
Mobile compounds this further. Synthetic benchmarks typically assume a stable network connection. Real mobile usage involves variable signal, background app refresh, thermal throttling on warm devices, and operating systems that aggressively suspend background processes. A benchmark run on a plugged-in iPhone in a quiet office has a meaningful but limited relationship to the same app running on a two-year-old Android phone with 60% battery in a subway station.
Google’s Chrome team learned a version of this when they began tracking Core Web Vitals in real-world conditions rather than lab conditions. The gap between lab performance scores and field performance scores turned out to be large enough, and consistent enough, that they built an entirely separate measurement pipeline for field data. Many sites that scored well in lab conditions scored poorly in the field. The difference was not that the lab was wrong. The difference was that the lab was not measuring users.
What We Can Learn
The practical lesson from the Facebook case is specific: the metric you optimize is the experience you deliver. If your benchmark does not include variable network conditions, background load, and device heterogeneity, it is measuring a user you do not actually have.
The tactical fixes are well-established at this point. Skeleton screens. Optimistic UI updates that assume success and roll back on failure, rather than waiting for confirmation before showing anything. Prioritizing above-the-fold content rendering before completing off-screen work. These are not novel ideas. Most engineering teams know about them. The reason they are underimplemented is not ignorance but measurement: if your dashboard shows response time and not perceived responsiveness, skeleton screens look like cosmetic work rather than performance work.
The deeper fix is to add field measurement alongside lab measurement. Tools for capturing real-user performance data (sometimes called RUM, for Real User Monitoring) have become significantly more accessible. The data they produce is noisier than benchmark data and harder to act on, but it describes actual users rather than theoretical ones.
The engineers who built the Facebook feed were not bad at their jobs. They were precise about the wrong things. Precision applied to the wrong measure produces confident, detailed, useless results. The benchmark said fast. The user said slow. The user was right, and the benchmark was too, and the only way to resolve that contradiction is to decide which one you actually care about.
Users do not experience your benchmarks.