Most engineering teams treat database replication as a binary: it’s either working or it’s broken. The replica is connected, the replication process is running, and the monitoring dashboard shows green. What those dashboards rarely show is how far behind the replica has fallen, and that number is where real data loss hides.
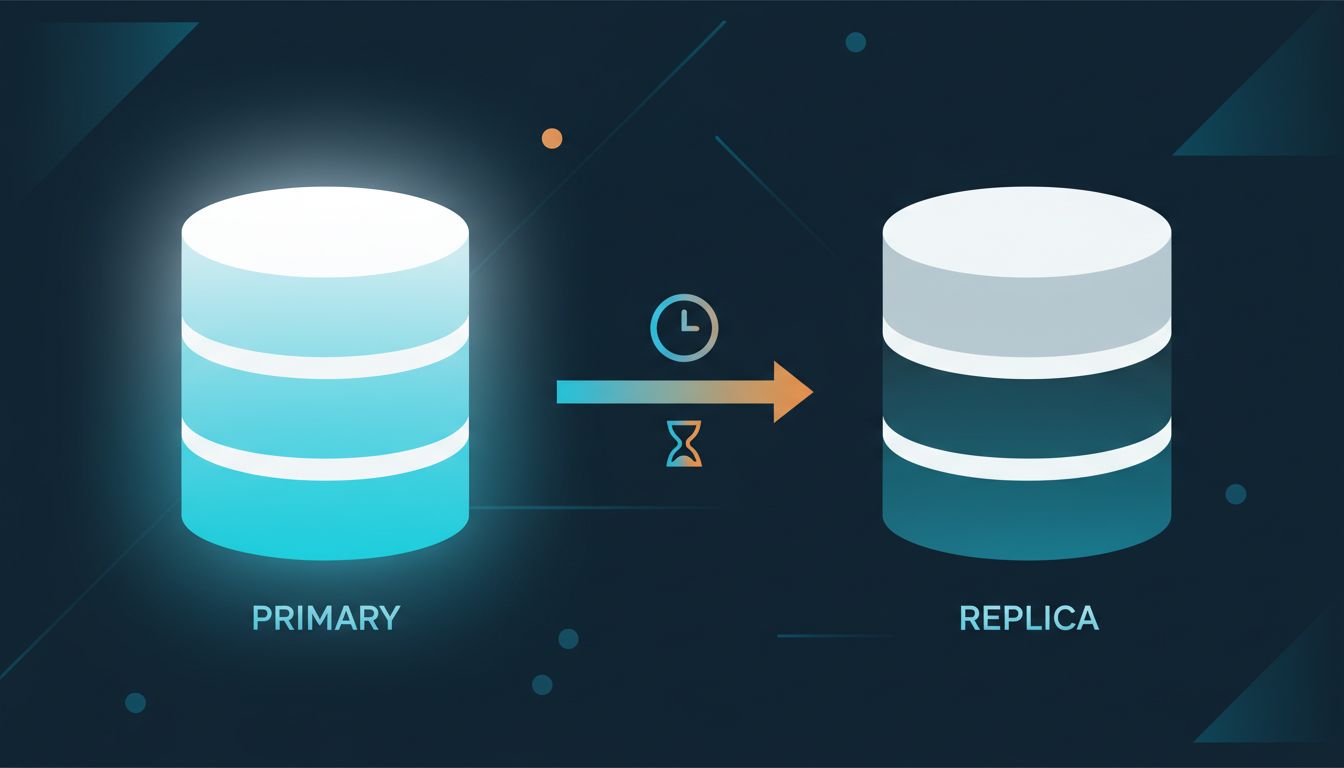
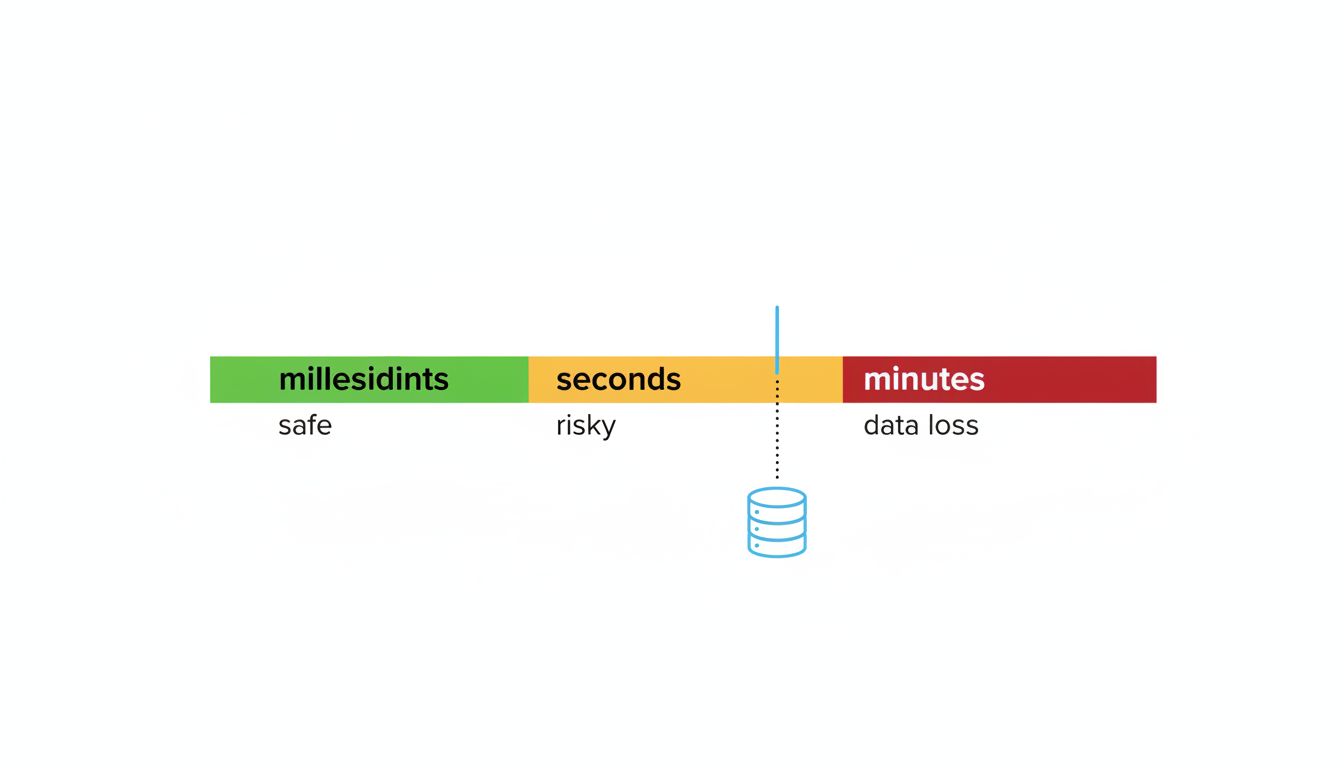
Replication lag is the time between a write hitting your primary database and that write being visible on a replica. In a healthy, lightly loaded system, lag might be milliseconds. Under write pressure, after a long-running transaction, or during a network hiccup, it can stretch to seconds, minutes, or longer. Most teams know this in theory. Almost none have set a hard alert on it.
This is a mistake with measurable consequences.
The Failure Mode Nobody Sees Coming
The scenario plays out like this. A user submits a payment. The write lands on the primary. Your application immediately routes the confirmation-page query to a read replica, which is 4 seconds behind. The replica has no record of the payment. Your code treats that as an anomaly, retries, or worse, tells the user the transaction failed. The user submits again. Now you have a double charge and an angry customer, and your logs show nothing wrong with the database.
This is not a theoretical edge case. Any application that separates reads and writes across primary and replica instances, which describes most architectures at even modest scale, is exposed to this failure. The application layer assumes the replica is current. The replica is not current. The application does something wrong with that stale data, quietly.
The insidious part is that nothing alerts. The replication process is healthy. The replica is connected. The lag metric, if it’s being collected at all, is often buried in a dashboard someone checks quarterly.
Measuring Lag Is Not the Same as Acting on It
Postgres exposes replication lag through pg_stat_replication. MySQL has SHOW SLAVE STATUS. Most managed database services surface it somewhere in their metrics. The data is available. The problem is that teams either aren’t collecting it or aren’t setting thresholds that trigger action.
There’s a meaningful difference between a lag alert that fires at 30 seconds and one that fires at 5 minutes. At 30 seconds, you have time to investigate before a significant chunk of writes are at risk. At 5 minutes, you’re already in an incident. Most teams who do alert on lag set thresholds that are too generous, chosen to avoid false positives rather than to reflect actual application risk.
The right threshold depends on your write volume and your read-after-write assumptions. If your application ever reads data immediately after writing it, your effective tolerance for lag is near zero. That means your alert threshold should be in seconds, not minutes, and your application logic needs a strategy for reads that absolutely must see fresh data, whether that’s reading from the primary for specific queries, using synchronous replication for critical tables, or implementing read-your-own-writes semantics explicitly.
Failover Makes It Worse
Automatic failover is widely understood as a reliability improvement. Under replication lag, it introduces a new failure mode. When your primary fails and your system promotes a replica, any writes that were replicated asynchronously and hadn’t yet reached the replica at the moment of failure are permanently lost. This is called replica divergence, and it’s the mechanism behind the “data loss” clause you’ll find in the fine print of nearly every managed database failover SLA.
The amount of data lost equals the writes committed to the primary during the lag window. If your replica was 8 seconds behind when the primary died, you’ve lost up to 8 seconds of writes. For a high-throughput system, that’s not a small number of rows.
This is why synchronous replication exists: it waits for at least one replica to confirm receipt before acknowledging the write to the client. The tradeoff is latency. Most teams choose asynchronous replication for performance reasons and accept the theoretical risk, without quantifying what that risk actually means for their specific write volume.
The Counterargument
The reasonable pushback here is that most applications can tolerate eventual consistency for most reads, that adding read-from-primary logic everywhere kills the performance gains from read replicas, and that synchronous replication introduces latency that degrades user experience in ways that are worse than occasional stale reads.
All of that is true and none of it is the point. The argument isn’t that you should eliminate replication lag or switch everything to synchronous replication. The argument is that you should know what your lag actually is, set alerts that reflect your application’s real tolerance, and make deliberate choices about which reads and writes need stronger guarantees. Right now, most teams are making none of those choices. They’re operating on the assumption that lag is negligible because they aren’t measuring it.
Unchecked lag also compounds with other operational costs in ways that aren’t obvious until something breaks. As the real cost of keeping a software product alive illustrates, the ongoing price of infrastructure decisions is rarely paid at the moment you make them.
What to Do About It
Start by actually measuring lag continuously and routing that metric into whatever alerting system your team responds to. Set a threshold that reflects your application’s read-after-write behavior, not a round number that felt safe at 2am when someone first configured the alert.
Audit the queries that run immediately after writes. Anywhere a user submits data and then sees a confirmation or result page, that read is likely going to a replica and may be returning stale data. Either force those reads to the primary, or add logic to handle the case where the expected data isn’t there yet.
For writes where losing even a few seconds of data is unacceptable, evaluate synchronous replication for those specific tables, even if the rest of your system runs asynchronously. The performance cost is real but bounded, and it’s a deliberate choice rather than an unknown exposure.
Replication lag is not a novel problem. The monitoring tools exist, the architecture patterns to address it are well documented, and the failure modes are predictable. The only reason it keeps causing incidents is that teams treat a green status light as a guarantee it isn’t.