
The Simple Version
When more users hit your app than one server can handle, a load balancer splits the traffic across multiple servers. How it splits that traffic determines which users get a fast experience and which ones stare at a spinner.
What a Load Balancer Actually Does
Imagine a restaurant with ten tables and one host at the door. The host decides where each party sits. A bad host seats everyone in the same section, overloads one waiter, and ruins dinner for a third of the room. A good host distributes parties based on table size, waiter capacity, and wait time.
A load balancer is that host, operating at a scale of thousands of decisions per second.
Every request your users make, logging in, loading a page, submitting a form, travels from their device to your infrastructure. Before it reaches any application code, the load balancer intercepts it and routes it to one of your available servers. The routing decision happens in milliseconds and is governed entirely by the algorithm you (or your cloud provider’s default settings) chose.
That choice matters more than most engineering teams treat it.
The Algorithms, and Where Each One Fails
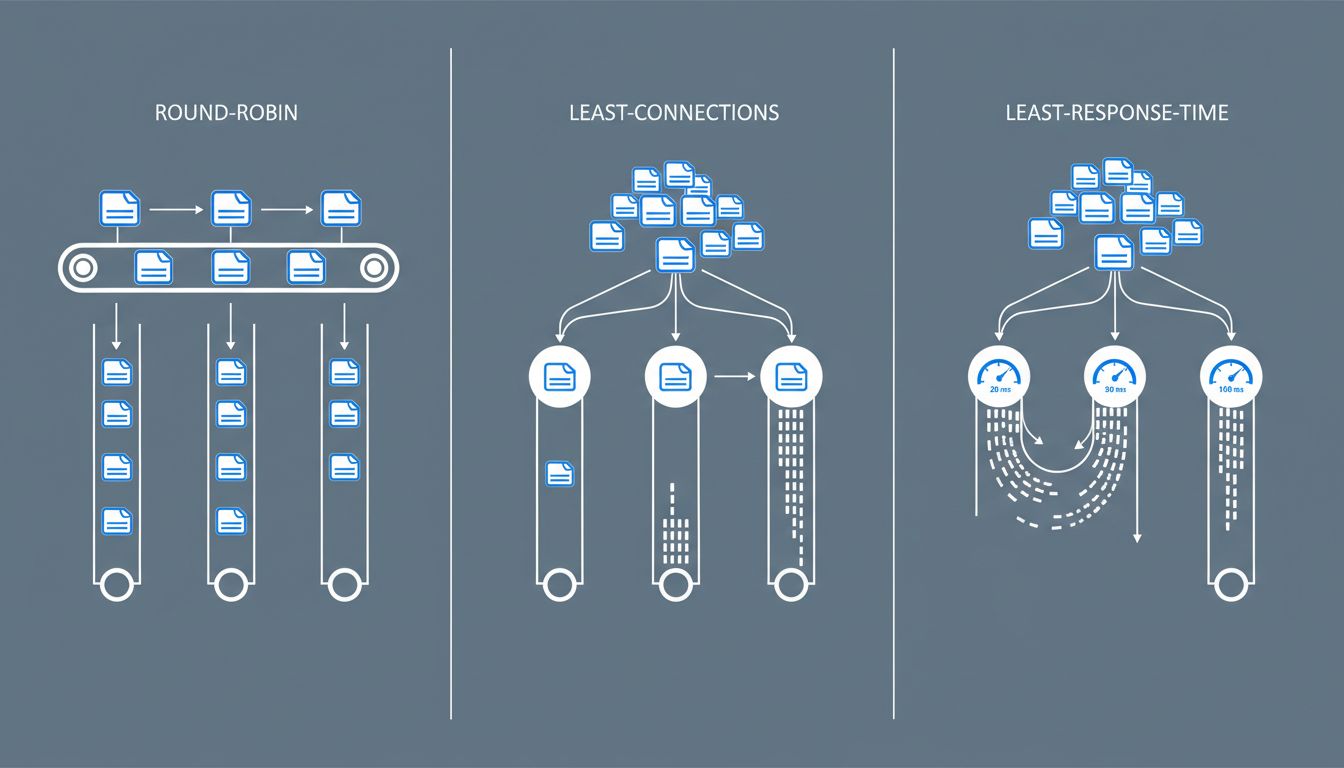
The most common approach is round-robin: server one gets request one, server two gets request two, server three gets request three, then back to server one. Simple, fair-seeming, and frequently wrong.
Round-robin assumes all requests are equal. They are not. A request to load a cached homepage takes milliseconds. A request to generate a PDF report, run a complex database query, or process a video upload can take seconds and consume substantial CPU. If your load balancer is distributing those requests in strict rotation, it will regularly pile three expensive requests onto one server while another sits idle processing trivial ones. The users hitting that overloaded server get slow responses. The algorithm doesn’t know or care.
Least connections is smarter. Instead of rotating mechanically, the load balancer sends each new request to whichever server currently has the fewest active connections. This handles unequal request weights better, because a server processing a slow request accumulates connections and gets fewer new ones until it catches up.
But least connections has its own blind spot: it counts connections, not load. Two connections on an old, underpowered server represent more strain than ten connections on a beefy one. Weighted least connections addresses this by letting you assign capacity weights to servers, so a server with twice the CPU gets proportionally more traffic. This works well when your servers are heterogeneous, which they often are in practice after years of incremental upgrades.
The most sophisticated common algorithm is least response time. The load balancer tracks how long each server is actually taking to respond and routes new traffic toward the fastest one. This is the closest thing to a self-correcting system: if a server starts slowing down due to load, memory pressure, or a problematic query, it naturally receives less new traffic.
Where It Goes Wrong in Practice
Knowing the algorithms exists as a solved problem. Configuring them correctly for your specific application is where teams consistently stumble.
Session persistence is a common culprit. Many web applications store session data locally on the server that handled the first request. If subsequent requests from the same user route to a different server, the session is gone and the user gets logged out, or worse, sees corrupted state. To prevent this, load balancers offer sticky sessions: once a user lands on server three, all their traffic goes to server three.
Sticky sessions solve the session problem and create a load problem. If you have a power user who runs long, complex workflows, they stay pinned to one server regardless of how busy it gets. Meanwhile the load balancer happily sends lighter users to underutilized servers, but your heavy user is stuck with whatever they landed on. The proper fix is storing session data in a shared layer (Redis is the standard choice) so any server can handle any request, making stickiness unnecessary.
Health checks are the other common failure point. Load balancers periodically ping your servers to confirm they’re alive before sending traffic there. But a health check that only verifies the server responds to a basic HTTP request will miss a server that is technically running but performing terribly because its database connection pool is exhausted or its disk is nearly full. A server can pass a health check and still be a terrible place to route user traffic. The bug that only appears under specific conditions is particularly dangerous here, because a shallow health check will never catch it.
The health check problem compounds during incidents. When a server starts failing, many load balancers will retry failed requests on another server. This sounds safe but can accelerate a cascade: the failing server’s load spills to healthy ones, which then start struggling, which triggers more retries, which adds more load. Engineers have a name for this. They call it a retry storm, and it has taken down systems that would have survived the original failure.
The Part Your Cloud Provider Doesn’t Configure For You
AWS, Google Cloud, and Azure all offer managed load balancers with sensible defaults. Those defaults are optimized for typical web traffic, not your traffic.
The practical gaps show up in a few places. Default timeout values are often either too short (killing legitimate long-running requests) or too long (holding connections to dead servers far past the point of usefulness). Default health check intervals can be too infrequent to catch rapid degradation. And default algorithms are almost always round-robin, because it requires no configuration knowledge from the user.
The teams that get this right treat load balancer configuration as application-specific tuning, not infrastructure boilerplate. They profile what their request mix actually looks like. They measure how long their p95 requests take and set timeouts accordingly. They build health checks that verify the application’s actual dependencies, not just its ability to return a 200 status code.
What This Means for Users
From a user’s perspective, none of this is visible. They click a button and either something happens quickly or it doesn’t. They have no way to know whether a slow response is their network, your application code, your database, or a load balancer that pinned them to an overloaded server three weeks ago and never let go.
This invisibility is why load balancer misconfiguration tends to persist. The symptoms look like intermittent slowness, which gets attributed to a dozen other causes before anyone checks routing decisions. And because the misconfiguration affects only a fraction of users at any given moment, aggregate metrics can look acceptable while specific users have a consistently bad experience.
The load balancer is not glamorous infrastructure. It sits below the application layer, generates few alerts, and rarely appears in post-mortems unless something catastrophic happens. That’s precisely why it deserves more deliberate attention than it typically gets. The algorithm running quietly at your network edge is making real decisions about real users. It should make those decisions on purpose.