Most load balancers deployed today use algorithms designed for a world of homogeneous hardware, synchronous request processing, and applications that did roughly the same work on every request. That world is largely gone. What replaced it are containerized workloads with variable CPU ceilings, services that fan out to a dozen downstream dependencies, and endpoints where one request is a simple cache read and the next triggers a machine learning inference job. The routing logic didn’t keep up.
This isn’t an abstract architectural complaint. It has real consequences for latency, resource utilization, and failure behavior. Here’s where the mismatch actually bites you.
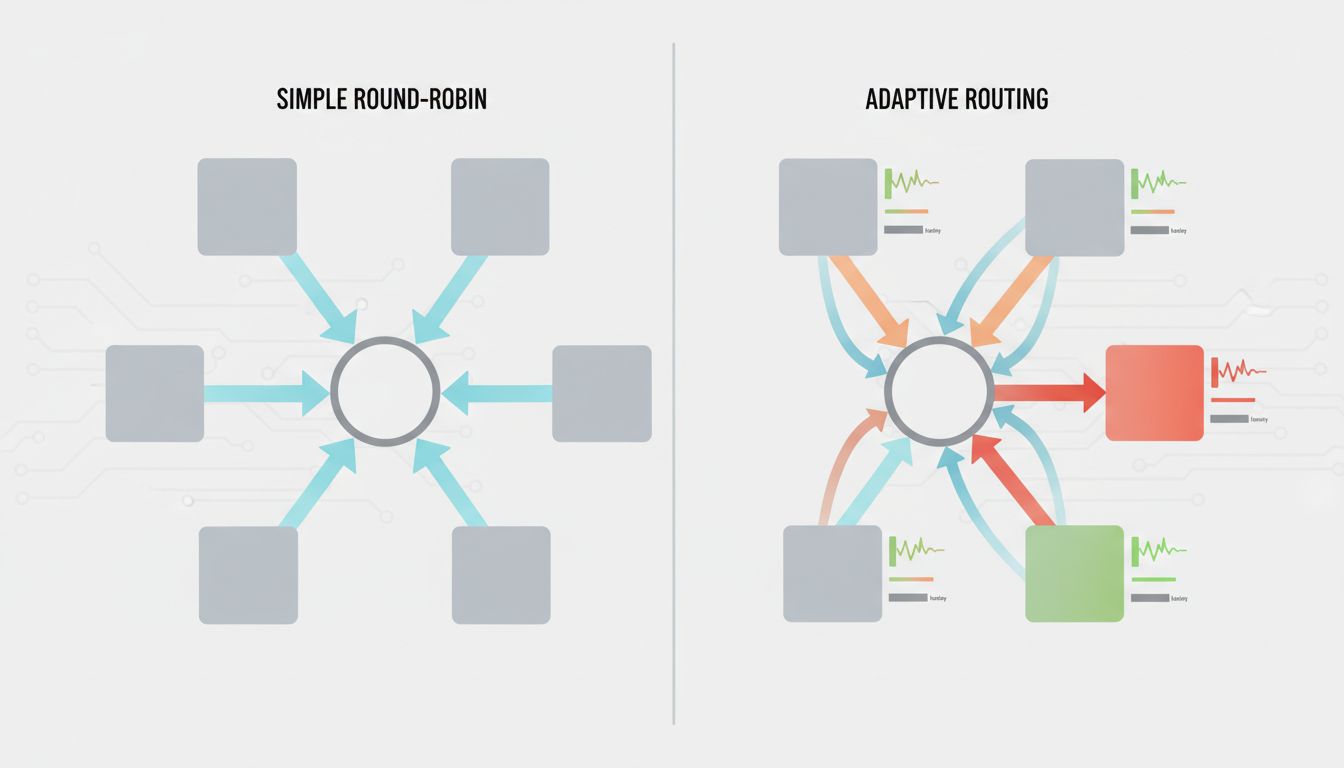
1. Round-Robin Assumes Every Server Is Equal
Round-robin is the default in most configurations because it’s simple and fair in the narrow sense: each server gets the same number of requests over time. This made sense when your backend was ten identical physical servers running the same application with the same memory and the same CPU. That assumption fails the moment you introduce Kubernetes, spot instances, or any environment where nodes have different resource profiles.
In a Kubernetes cluster, a pod that’s been running for two hours might have a JVM with a warm heap and well-compiled hotspot code. A pod that just started is cold, and the JVM is still interpreting bytecode. Round-robin sends them equal traffic. The new pod is slower, queues build, and your p99 latency climbs for no obvious reason. The fix isn’t more pods. The fix is routing that accounts for actual capacity and response time, not theoretical equality.
2. Least-Connections Ignores Request Cost
Least-connections routing is smarter than round-robin in that it at least looks at current load. It routes new requests to whichever backend has the fewest active connections. This is better, but it confuses connection count with work being done.
Consider an API where some endpoints return a JSON blob from cache in two milliseconds and others trigger a database join across several large tables that takes 400 milliseconds. Least-connections treats these identically. A server with 50 active cache reads is considered busier than a server with 10 active expensive queries, so the router happily sends more expensive queries to the second server until it’s clearly saturated. The metric being measured (connections) is a poor proxy for the metric that matters (resource consumption). Systems like Envoy’s peak EWMA (exponentially weighted moving average) algorithm address this by tracking actual request latency rather than connection count, and the performance difference in heterogeneous workloads is substantial.
3. Health Checks Declare Servers Healthy When They’re Functionally Impaired
The standard health check is an HTTP GET to a /health endpoint that returns 200. The server is either up or down. This binary model misses the most interesting failure modes, which are the gradual ones.
A server can return 200 on its health endpoint while its connection pool to the database is 95% exhausted. It can pass a health check while its garbage collector is running a full collection every few seconds. It can respond to a ping while a memory leak is compressing its available heap. These servers aren’t down. They’re slow. They’re accepting requests and handling them poorly. A routing layer that only knows about up/down sends them full traffic until the health check finally fails, which often happens after the node has been struggling for minutes.
The more useful model is progressive degradation scoring. Rather than a binary health state, track error rate, response time, and resource signals continuously, and reduce traffic to nodes that are trending poorly before they fail completely. Netflix’s approach to this within their Hystrix and later resilience patterns recognized this problem over a decade ago. Many teams are still deploying binary health checks.
4. Session Affinity Creates Uneven Load You Can’t See
Sticky sessions, where a load balancer routes a given client to the same backend on every request, exist because some applications store session state locally rather than in a shared cache or database. This was a reasonable workaround when refactoring session handling was expensive. Sticky sessions solve that problem by creating a different one.
The core issue is that not all users are equally expensive. A session that belongs to a large enterprise customer running automated batch exports is stickied to the same node as that customer’s 50-person team doing concurrent reads. That node is consistently overloaded compared to nodes whose sticky sessions happen to be lower-traffic users. From the outside, all nodes look roughly equivalent. Internally, load is skewed by the accident of which users got routed where, which depends on historical patterns that have nothing to do with current demand.
The correct fix is stateless application design with a shared session store. Redis has been a practical solution to this since the mid-2000s. If sticky sessions are still in your architecture for availability reasons rather than active design decisions, that’s worth examining.
5. Your Routing Logic Doesn’t Know About Downstream Dependencies
A load balancer sitting at the edge of your system routes based on the state of the servers it’s directly connected to. It has no visibility into what those servers depend on. This creates a category of failure that’s hard to diagnose: the server is healthy, accepting connections, and responding quickly to requests it can handle locally, but it’s also queuing or timing out on anything that needs a downstream service.
If your backend talks to a third-party payment API that’s degraded, a particular microservice that’s running slow, or a database replica that’s falling behind on replication, the load balancer doesn’t know. It keeps routing traffic to all nodes equally. The nodes that happen to be serving requests that need the slow dependency fail or time out. The nodes serving requests that don’t touch that dependency look fine. Your aggregate error rate rises without any single server appearing unhealthy.
Service mesh architectures (Istio, Linkerd) address part of this by pushing routing intelligence closer to the application and making inter-service traffic observable. But they add real operational complexity, and many teams adopt them without actually configuring the circuit breaking and outlier detection features that would solve this problem. Installing a service mesh and not configuring its traffic policies is a bit like installing a circuit breaker panel and leaving all the breakers off.
6. Configuration Drift Makes All of This Worse
Load balancer configuration is often set once and revisited only when something breaks. The timeouts, weights, health check intervals, and algorithm choices made during the initial deployment were calibrated for the traffic patterns and server characteristics of that moment. Applications change. Traffic profiles change. Hardware gets replaced. The configuration doesn’t.
A timeout of 30 seconds made sense when your slowest endpoint occasionally took 25 seconds under load. If that endpoint has been refactored and now completes in two seconds at worst, you’re holding connections open for 28 seconds longer than necessary during failure scenarios, which amplifies cascading failures rather than containing them. These calibration mismatches accumulate quietly, and they tend to matter most exactly when you can least afford it, during incidents, when traffic is unusual, or when a dependency is degraded.
The underlying principle here is one that applies broadly to infrastructure: defaults are someone else’s assumptions about your workload, and the longer you leave them in place, the more likely it is that your workload has outgrown them. The most dangerous software bugs are always found in the most boring code, and load balancer configuration is among the most boring code in any stack. That’s precisely why it accumulates risk.