When a production AI feature feels slow, the instinct is to blame the model. It’s the glamorous, expensive, GPU-hungry part of the system. It must be the bottleneck. So teams spend weeks experimenting with quantization (reducing numerical precision to speed up computation), distillation (training smaller models to mimic larger ones), and batching strategies. Then they profile the actual pipeline and find the model inference step takes 80 milliseconds while their preprocessing code takes 400.
This happens constantly. And it happens because inference is the part of the pipeline everyone thinks about, while everything around it gets assembled from convenience code that was never meant to carry production load.
Where the Time Actually Goes
A typical AI pipeline looks roughly like this: receive input, validate and clean it, transform it into the format the model expects (tokenization for language models, resizing and normalization for vision models), run inference, post-process the output, and return it. Engineers benchmark the inference step carefully and treat everything else as boilerplate.
But tokenization is not free. If you’re running a language model and tokenizing on the CPU for each request individually rather than batching, you’re paying that cost serially. String manipulation in Python, especially with complex Unicode handling or regex-heavy cleaning pipelines, can be surprisingly expensive at scale. Deserializing a large JSON payload, running it through validation logic, and reformatting it for model input often takes longer than the forward pass through a moderately sized model.
I/O is the other silent killer. If your pipeline fetches context from a database or vector store on every request, that round trip can dwarf inference time, especially if your database isn’t co-located with your inference server or your connection pool is undersized. You’re essentially running a fast model behind a slow data retrieval layer and wondering why the whole thing feels sluggish.
The Orchestration Tax
Modern AI features rarely call a single model. A retrieval-augmented generation (RAG) system, for example, embeds the user query, searches a vector database, retrieves relevant chunks, constructs a prompt with that context, and then calls the language model. Each of those steps has latency, and if they’re wired together naively in sequential async calls where some could be parallelized, you’re paying an orchestration tax.
Frameworks like LangChain and LlamaIndex are convenient for prototyping, but they can introduce overhead that’s opaque and hard to profile. They abstract away the plumbing, which is exactly what makes them fast to build with and slow to optimize. When you can’t see what’s happening between the steps, you can’t measure it, and what you can’t measure you can’t fix.
The fix isn’t to abandon these tools. It’s to treat orchestration code with the same skepticism you’d apply to any other performance-critical path. Instrument everything. Use a tracing tool (OpenTelemetry works well here) to put a span around every discrete step. When you can see a waterfall chart of your actual request lifecycle, the real bottlenecks become obvious very quickly.
Caching Is Underused in Almost Every Pipeline I’ve Seen
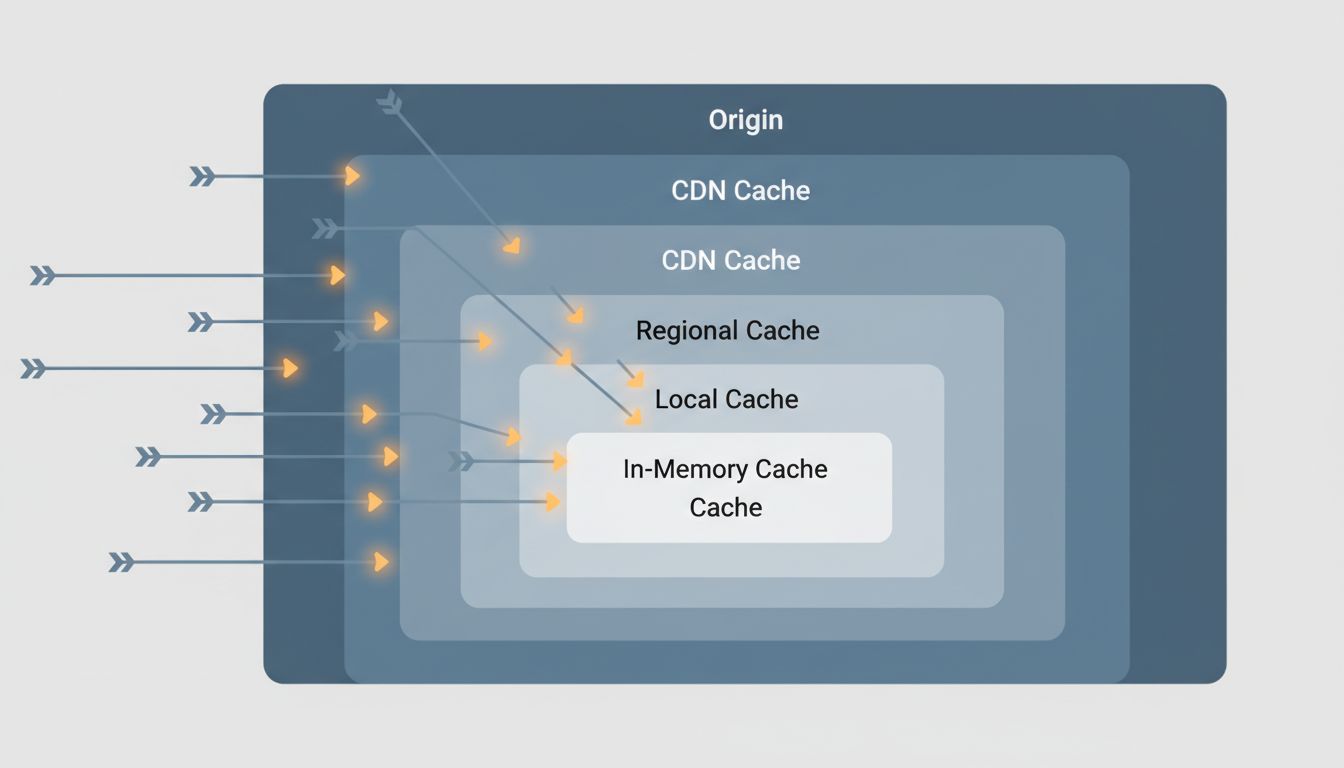
Many AI pipelines are more repetitive than they appear. In a customer-facing product, a meaningful fraction of incoming queries are semantically similar or even identical. If your pipeline computes an embedding (a vector representation of text) and then does a vector search on every single request, you’re doing redundant work. Caching embedding results for common queries with a reasonable TTL (time-to-live, how long a cached value is kept before being discarded) can eliminate entire stages of the pipeline for a large chunk of traffic.
Prompt construction is another caching opportunity people miss. If you’re building a prompt that includes a large, static system message or retrieved documents that don’t change frequently, some inference providers support prompt caching, where the key-value cache (the internal state the model builds up as it processes tokens) is preserved across requests. Anthropic’s API, for example, explicitly supports this. For prompts with thousands of tokens of shared context, this can meaningfully reduce both latency and cost.
Result caching is the bluntest instrument and also the most effective when applicable. If your application lets users ask the same or similar questions repeatedly, returning a cached response from a previous identical query is orders of magnitude faster than any optimization you can make to the inference step itself.
Profiling AI Code Requires Different Habits
Standard profiling tools don’t always give you a useful picture of an AI pipeline. cProfile in Python will tell you where CPU time goes, but it won’t capture time spent waiting on network calls, GPU utilization, or the latency of external service dependencies. You need a combination of tools: wall-clock timing around each stage, distributed tracing if your pipeline spans multiple services, and GPU profiling tools like NVIDIA Nsight if you’re trying to squeeze the last bit out of actual inference.
The habit worth building is profiling end-to-end before optimizing anything. It sounds obvious, but the pressure to show progress pushes teams toward optimizing the part they understand best (the model) rather than measuring the system as a whole. A retrieval step that’s adding 300 milliseconds because you forgot to add an index to your vector store is not going to get faster no matter how aggressively you quantize your model. The two problems don’t overlap.
This connects to something worth taking seriously: prompt engineering and parameter choices can affect what your model returns, but they don’t fix a slow data layer. Optimizations need to target the actual constraint.
What to Actually Do First
Before touching model configuration, do three things. First, add wall-clock timing to every discrete stage of your pipeline and log it. Second, look at your data retrieval: are you fetching more than you need, and could any of it be cached? Third, look for work you’re doing serially that could be parallelized.
In most production systems I’ve seen profiled, these three interventions alone are worth more than any model-level optimization. Inference speed matters, and there are real wins available there, but they’re the last place to look, not the first. The model is the brain of your pipeline. But if the nervous system carrying signals to and from it is the bottleneck, the brain’s raw processing speed is irrelevant.