
In 2020, Discord’s engineering team published a post-mortem on a persistent performance problem that had been hiding in plain sight. Their Go-based services were reporting median response times under a millisecond. Users were complaining about lag. Both things were true simultaneously, and the contradiction pointed to something fundamental about how the industry measures server performance.
The median was fine. The 99th percentile was not. And the 99th percentile was what users actually experienced during the moments they noticed.
The Setup
Discord had built a message caching system in Go. Average latency looked acceptable on their dashboards. But Go’s garbage collector periodically pauses all goroutines to reclaim memory, and those pauses, which could last several milliseconds, were invisible to the metrics they were tracking. A user hitting the service during a GC pause would wait ten times longer than the median. The dashboard showed a healthy system. The system was not healthy for a meaningful fraction of requests.
This is not a Discord-specific failure. It is the default failure mode of how most engineering teams report latency.
What Averages Hide
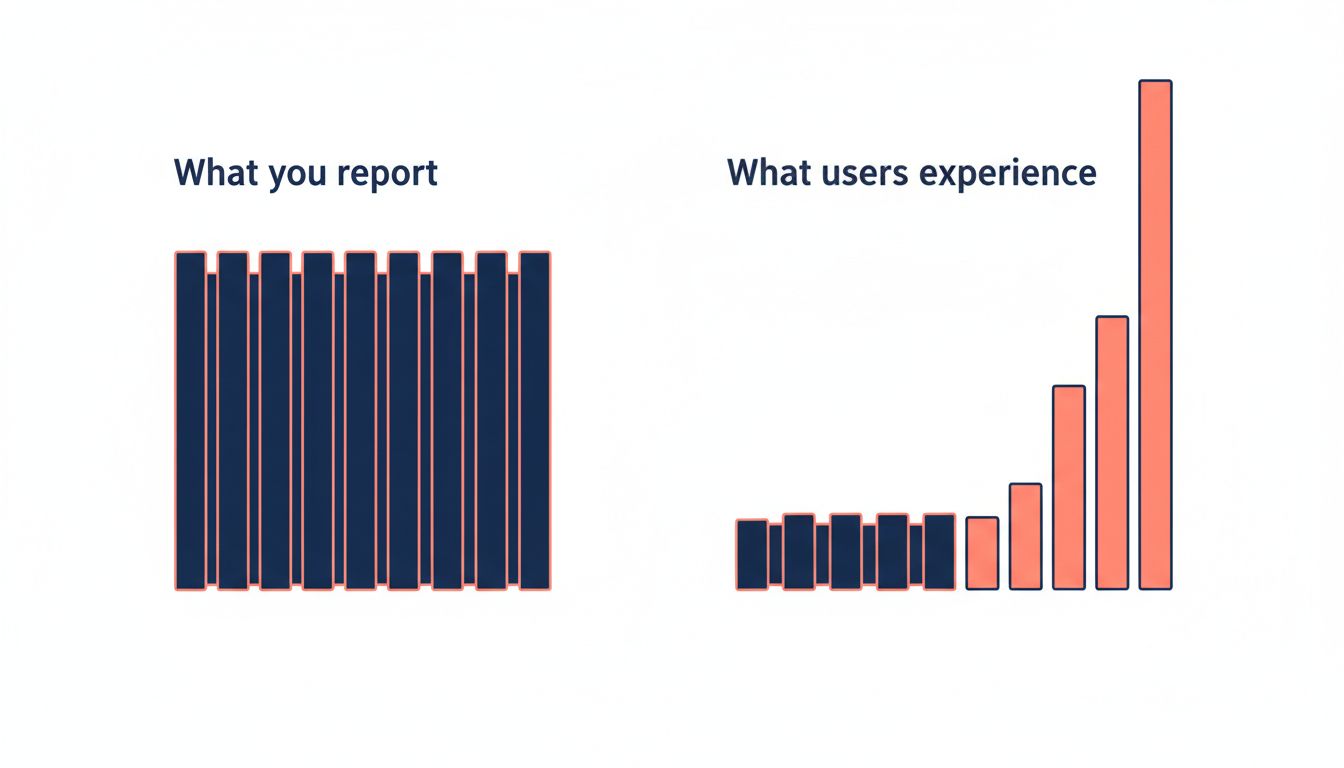
Latency distributions are not bell curves. They are right-skewed: a long tail of slow requests pulls far to the right of the median. When you report average (mean) latency, you are mathematically required to understate what bad looks like. The average smooths over the outliers that your actual users are experiencing.
Percentile metrics exist specifically to address this. The p99 latency is the response time that 99% of requests fall under. The p999 (99.9th percentile) captures the worst one-in-a-thousand request. These numbers are harder to make look good, which is precisely why they matter more.
The problem is deeper than just choosing the wrong metric, though. Even percentile measurements can lie, depending on how you collect them.
How Measurement Itself Distorts the Picture
Consider how most systems collect latency data. A server receives a request, processes it, and records how long that took. The measurement starts when the server begins work and ends when the server finishes. This seems correct. It is not.
First, there is the coordinated omission problem, a term coined by Gil Tene, co-founder of Azul Systems and creator of the HdrHistogram library. If your system is under load and requests are queuing, the requests that are waiting in queue are not being measured. Your histogram fills up with the fast requests that got through; the slow ones are still waiting. When load lightens, those queued requests finally complete, and they look like normal requests in your metrics because you only start timing them when they start processing. The queue time disappears entirely.
This is not a theoretical edge case. It is what happens during every traffic spike. The moments when latency is worst are precisely the moments when your measurement system is most likely to undercount it.
Second, there is the question of where you measure. Server-side latency and client-side latency are different numbers. Network round-trip time, time waiting for a connection from a pool, time blocked on the client before the request is even sent: none of these show up in server-side metrics. Engineers optimizing server response times can achieve real improvements while users see no change at all.
Google’s Site Reliability Engineering book addresses this gap directly, arguing that user-facing latency targets must be set and measured from the client perspective. The server’s view is useful for debugging but insufficient for knowing whether users are suffering.
The Discord Resolution and Its Lesson
Discord eventually migrated their message caching service from Go to Rust, which lacks a garbage collector and therefore lacks GC pauses. Their p99 latency dropped substantially. The median barely changed. This is the correct outcome: an optimization that improves the worst-case experience without touching the average case is still a major win, because the worst-case experience is disproportionately what users remember and report.
But the deeper lesson is not “use Rust.” It is that the Discord team only found this problem because they were looking at percentile distributions and asking why p99 diverged so dramatically from p50. Teams that only monitor averages would have seen a healthy service and gone looking elsewhere for the source of user complaints.
The measurement choice is a business decision with real consequences. SLA contracts are increasingly written around percentile guarantees rather than average response times, partly because customers have gotten wise to how averages can mask terrible tail behavior. A vendor can truthfully claim sub-millisecond average latency while delivering multi-second responses to one in a hundred users. That vendor is not lying in any legal sense. They are presenting the number that flatters them most.
What Good Measurement Actually Requires
Three practices separate teams that understand their latency from teams that merely track it.
First, use histograms rather than pre-aggregated percentiles. A p99 calculated by your metrics library before the data is sent to your monitoring system is a summary that cannot be re-analyzed later. A histogram preserves the shape of the distribution and lets you slice it by endpoint, user cohort, or time window after the fact. HdrHistogram, which Tene open-sourced, handles the coordinated omission problem explicitly by allowing you to record the full time a request was in-flight, including queue time.
Second, measure from where users are. Synthetic monitoring tools that issue requests from external locations and record round-trip time are not optional for any service that users access over the internet. Real User Monitoring (RUM), which collects timing data from actual client devices, goes further. The gap between what your servers report and what your RUM data shows is the gap between your mental model of your system and reality.
Third, set your targets at the tail, not the median. Amazon’s internal guidelines, as described in their 2007 Dynamo paper, explicitly focus engineering work on p99.9 latency. This is demanding and produces systems that are genuinely difficult to build, which is the point. Most distributed systems fail the same six ways, and latency spikes during degraded conditions are among the most common failure signatures. Teams that only optimize for the median have little visibility into how their system behaves when something is wrong.
The Number That Matters
There is a useful heuristic from Jeff Dean, Google’s distinguished engineer whose work on large-scale systems has defined much of the field’s understanding of tail latency: in any system where a single user request fans out to dozens or hundreds of backend calls, the overall request completes only when the slowest component finishes. In a system making 100 parallel backend calls, even if each call has a p99 latency of 10ms, the probability that at least one of those 100 calls hits that tail is nearly certain. The user experiences the maximum, not the median.
This arithmetic is uncomfortable. It means that improving your median latency has essentially no effect on the experience of users whose requests touch many services. Improving your tail latency improves everyone.
The server that responds in microseconds on average is telling you a true thing about itself. It is probably not telling you anything useful about your users.