
Amazon Web Services went down for 49 minutes on August 31, 2013. Not a catastrophic failure. Not a prolonged crisis. Forty-nine minutes, and the incident is still cited in reliability engineering discussions a decade later because of what it revealed about the gap between contractual uptime and operational reality.
The AWS SLA at the time promised 99.95% availability for EC2. Forty-nine minutes of downtime in a month represents roughly 99.89% availability, which technically missed the threshold. But here’s the part that mattered to no one writing the SLA: AWS processed, at that point, somewhere between $10 and $13 million in transactions per minute for its retail customers during peak periods. Forty-nine minutes of partial degradation across a subset of services cost real businesses real money in ways that a percentage point on a contract simply cannot capture.
This is the story of how the tech industry settled on uptime percentages as the primary language of reliability, why that was always the wrong metric for most businesses, and what the companies that learned this lesson the hard way eventually replaced it with.
The Setup: A Number That Spread Because It Was Easy to Sell
Uptime percentages became the standard reliability currency for a mundane reason: they’re easy to compare. A sales engineer can put “99.9%” in a slide and a procurement team can put it in a spreadsheet next to a competitor’s “99.5%” and feel like they’ve done due diligence.
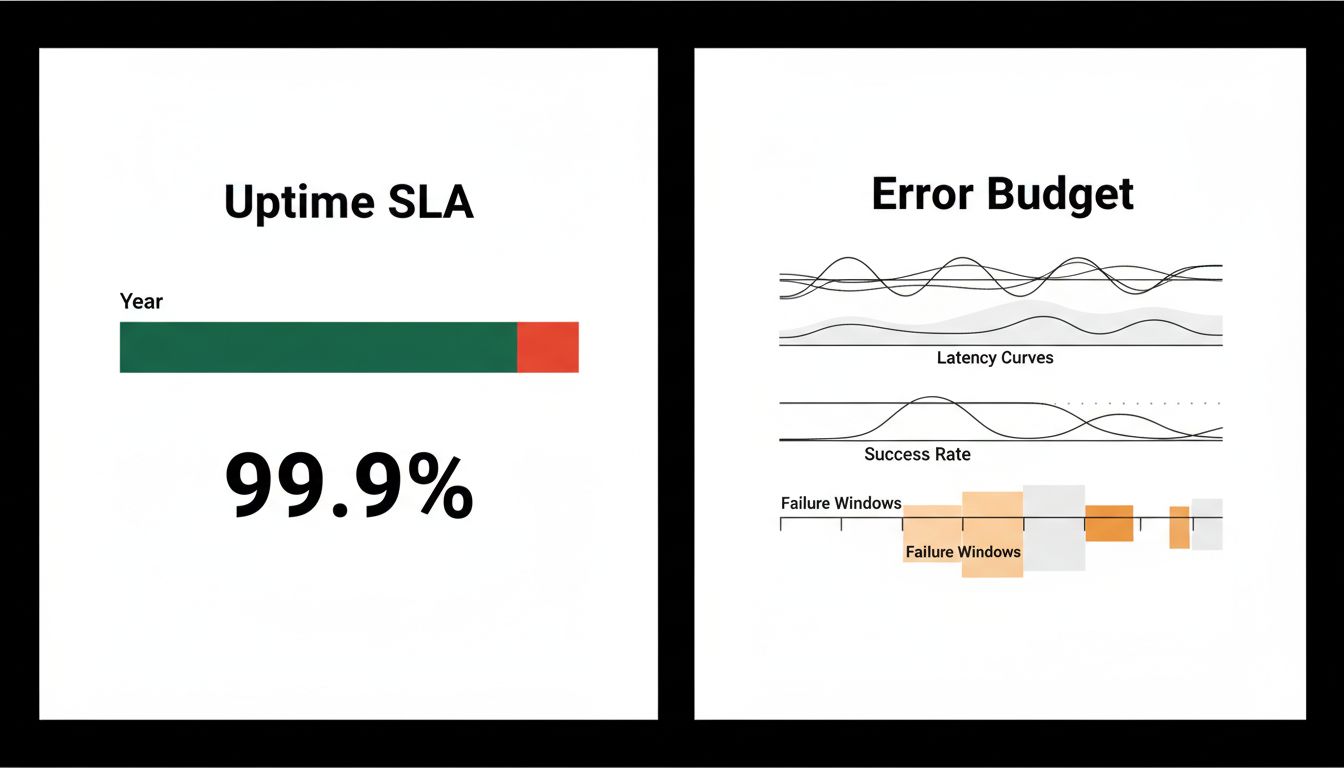
The math looks simple. 99.9% uptime allows for 8.76 hours of downtime per year, or roughly 43.8 minutes per month. 99.99% (“four nines”) allows for about 52 minutes per year. The numbers are clean, the comparisons feel objective, and the contracts write themselves.
But the number obscures at least four things that actually determine whether your business survives an outage.
First, timing. Downtime is not distributed randomly across the calendar. A 40-minute outage at 2am on a Tuesday is operationally different from a 40-minute outage at noon on Black Friday. Both count the same toward your annual uptime percentage. For an e-commerce business that does 30% of its annual revenue in November and December, this distinction is not academic.
Second, partial failures. Most modern outages are not binary. A service might be technically “up” while responding in 8 seconds instead of 300 milliseconds, processing only 60% of requests successfully, or returning corrupted data for specific query types. None of this appears in an uptime calculation. The AWS 2013 event was classified as a partial degradation for much of its duration, which is how a 49-minute incident affected businesses that were, on paper, looking at a system showing green.
Third, recovery time. Two services can both achieve 99.9% uptime with radically different failure patterns. One might experience a single 8-hour outage once a year, while another might experience brief 5-minute incidents spread across the year. The percentage is identical. The operational experience is not. Businesses that depend on a service for time-sensitive workflows (payment processing, real-time logistics, communications) find 8-hour recoveries existentially threatening in ways that scattered 5-minute blips are not.
Fourth, the measurement window. Monthly SLAs allow providers to reset the clock each month. A provider that hits 99.9% every month but consistently fails on the last day of the quarter meets their contractual obligation while predictably disrupting their customers during financial close processes.
What Happened: The Metrics That Actually Got Measured
The companies that moved past uptime percentages as their primary reliability signal generally did so after a painful incident that exposed the gap between what their SLA said and what their business experienced.
Stripe is instructive here. The payments infrastructure company has been unusually transparent in its incident postmortems, and what you find in those documents is almost no focus on percentage uptime. The language is about payment success rates, latency percentiles (specifically p99 and p99.9, meaning the 99th and 99.9th percentile response times), and error rates broken down by failure type. These metrics have direct business translation. If your payment success rate drops from 99.7% to 97.2% for 12 minutes, you can calculate exactly how many transactions failed, estimate how many customers abandoned rather than retried, and model the downstream revenue impact.
This is fundamentally different from knowing that your provider achieved 99.94% uptime for the month.
Google’s Site Reliability Engineering (SRE) framework, documented in their 2016 book and now widely adopted, centers on a concept called the error budget. Rather than targeting maximum uptime, teams are given a permissible quantity of failures per period and asked to spend that budget strategically. A service targeting 99.9% availability has 0.1% to “spend” on failures, planned maintenance, and deployments. This reframes reliability from a compliance exercise into a resource allocation decision. The architectural thinking behind this, where systems are designed to absorb failure rather than prevent it entirely, is worth understanding in detail.
The error budget model also changes incentives. Under a traditional uptime SLA, an engineering team is rewarded for avoiding any downtime. Under an error budget, a team that never touches its budget is probably moving too slowly and should be deploying faster. The budget is meant to be used.
Why It Matters: The SLA Is Written for the Vendor, Not the Customer
This is the position worth taking plainly: most uptime SLAs are structured to protect the vendor from liability, not to align the vendor’s incentives with the customer’s operational needs.
The standard remedy for a missed SLA is a service credit, typically a small percentage of monthly spend. If you pay $10,000 per month for a service and it goes down for 5 hours, causing you to miss a $2 million contract renewal meeting, your credit is probably $300. The incentive structure does not reward the vendor for preventing your specific category of harm. It rewards them for averaging well.
This misalignment is why sophisticated buyers have started writing their own reliability requirements in terms of outcomes rather than percentages. Enterprise contracts for mission-critical infrastructure increasingly specify maximum allowed latency at the 95th percentile, minimum transaction success rates for defined operations, required recovery time objectives (RTOs) for specific failure scenarios, and geographic failover requirements. These are harder to measure, harder to audit, and harder to negotiate. They are also much harder to game.
What We Can Learn: The Right Question Is Never the Percentage
The arithmetic of uptime percentages encourages a specific kind of thinking: how much downtime is acceptable in aggregate? The better question is: what failure modes are unacceptable for our specific business, and what would we need to measure to know when we’re approaching them?
For a company processing payroll, a 2-hour outage on the 15th and 30th of the month is catastrophic. Those two days represent nearly all of the operational risk. A service with 99.99% uptime that reliably fails on those dates is worse than a 99.9% service that fails randomly.
For a real-time trading platform, latency percentiles matter more than binary uptime. The platform can be “up” while being completely unusable for its core purpose if p99 response time exceeds 200 milliseconds.
For a developer tools company serving individual engineers, short frequent outages during business hours erode trust faster than longer off-hours incidents, because the customer is present for the former and asleep for the latter.
The companies that build genuine reliability into their products track failure modes that map to user outcomes, not percentages that map to contract compliance. They publish p95 and p99 latency. They report partial degradations. They categorize incidents by impact, not just by duration.
None of this is technically complex. It requires deciding to measure the thing that matters instead of the thing that’s easy to report. That decision, consistently, is harder than it sounds.