
The Bug That Vanishes the Moment You Look at It
You’ve been there. A user reports something broken. You sit down to reproduce it, follow every step they described, and nothing happens. The bug is gone. You add logging, run it again. Still fine. You ship the build without the logging. The bug comes back.
This isn’t bad luck. It’s a category of problem with a name: a Heisenbug, borrowed from Heisenberg’s uncertainty principle, where the act of observing a system changes the system’s behavior. Understanding why these bugs work the way they do gives you a real framework for hunting them down.
1. Timing Is the Root Cause of Most Heisenbugs
The single most common reason a bug disappears under observation is that you’ve changed the timing of your program. Adding a breakpoint pauses execution. Adding a log statement takes microseconds. Attaching a debugger introduces overhead. Any of these can be enough to let a race condition resolve cleanly that would otherwise produce corrupted state.
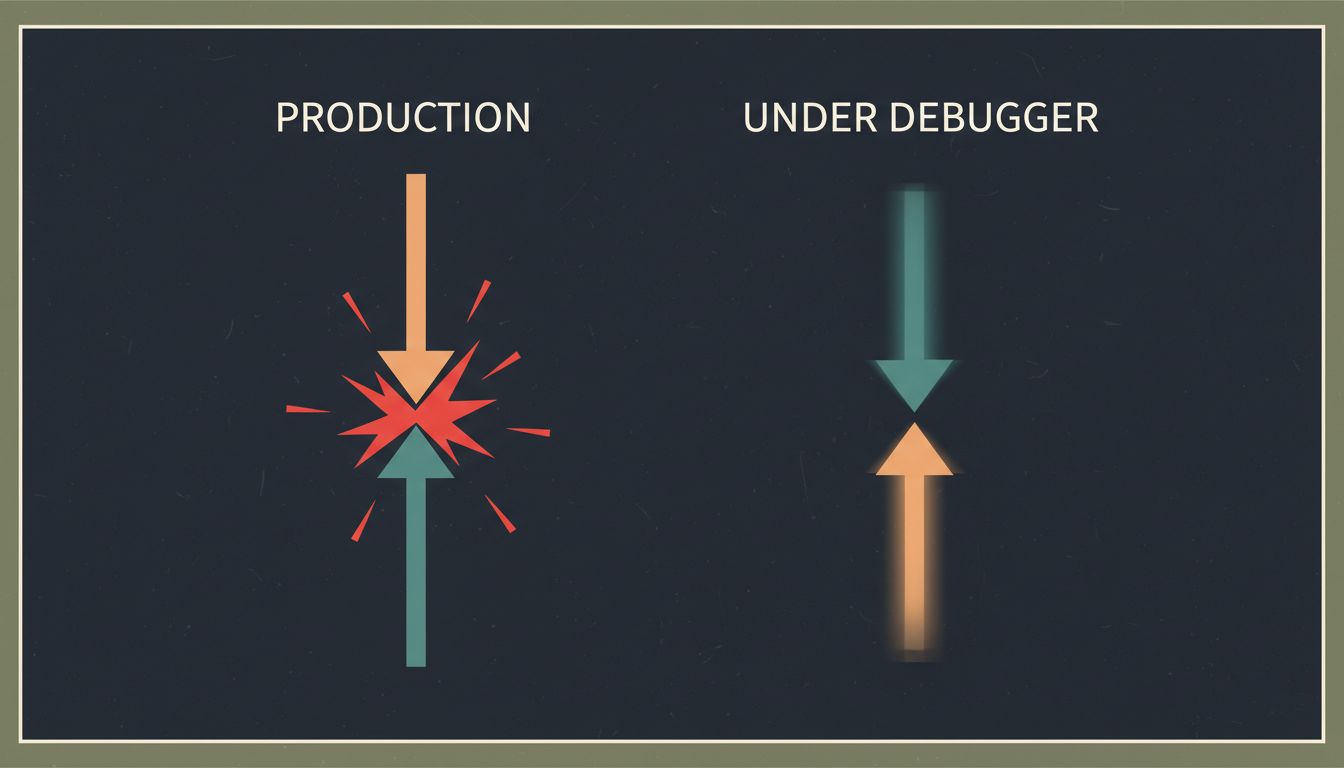
Race conditions are the classic example. Thread A writes a value while Thread B reads it, and whether the read happens before or after the write determines whether you get a valid result or garbage. In production, the threads run at full speed on real hardware with real load. Under a debugger, the pause gives Thread A time to finish before Thread B arrives. The race disappears. The bug disappears with it.
The practical move: stop relying on your debugger as a first step for any bug involving concurrency, network calls, or timing-sensitive state. You need techniques that observe without changing the clock.

2. Logging Changes Behavior More Than You Think
Adding console.log or equivalent feels harmless. It usually is. But logging has side effects that matter in tight loops or concurrent code. It acquires locks on the output stream. It flushes buffers. It can cause the garbage collector to run at a different time. In a language with a GIL (like Python), heavy logging in a tight loop genuinely changes thread scheduling.
There’s also the heap allocation problem. In languages where strings are heap-allocated, constructing a log message allocates memory. That allocation can trigger a GC cycle that pauses your thread just long enough to let another thread get ahead, resolving the very race condition you were trying to observe.
The fix isn’t to avoid logging. It’s to use append-only, lock-free logging where possible, and to treat your logs as evidence gathered after the fact rather than a live probe. Structured logging to a ring buffer that flushes asynchronously gives you observability without meaningfully touching your program’s timing.
3. Release Builds and Debug Builds Are Different Programs
Optimizing compilers are aggressive. In a release build, your compiler will reorder instructions, eliminate “unnecessary” variable reads, inline functions, and fold constants in ways that a debug build never will. Code that looks safe in source form can produce unsafe machine code when optimized, particularly around memory ordering in concurrent programs.
This is why volatile exists in C and C++, and why Java’s memory model explicitly covers visibility guarantees across threads. If you’ve ever seen a bug that only reproduces in production builds and never in debug, look first at whether your compiler is reordering memory accesses in a way that breaks an assumption in your concurrent code.
Practical check: if you’re using C or C++, run your debug builds with -fsanitize=thread (ThreadSanitizer) and -fsanitize=address. These instrumentation passes add overhead but catch real data races and memory errors that would otherwise only surface in production. They’re not perfect, but they catch a large class of problems without requiring you to reproduce a race at the exact right moment. Many teams pay more than they expect for production debugging tools when the real investment should have been in pre-production instrumentation.
4. Environment Differences Are a Hidden Trigger
A Heisenbug doesn’t have to be about timing. Sometimes it appears in production and not locally because production is simply a different environment. Different CPU count means different scheduling. Different memory means different allocation patterns and GC pressure. Different OS means different filesystem behavior, different default socket buffer sizes, different clock resolution.
One subtle case: hardware memory ordering. x86 CPUs have a relatively strong memory model; ARM CPUs have a weaker one. Code with subtle memory ordering bugs might run correctly on your x86 development machine and fail on ARM production servers or mobile devices. This category of bug is genuinely hard to reproduce until you’re running on the right hardware.
When a bug only appears in production, your first investigation shouldn’t be “what’s wrong with my code” but “what’s different about the environment.” Build a checklist: CPU count, available memory, OS version, kernel configuration, filesystem type, network latency to dependencies. Then try to reproduce locally with those constraints applied.
5. Schrodinger’s State: Bugs Triggered by Memory Layout
Some bugs only exist when your data is arranged a specific way in memory, and that arrangement is non-deterministic between runs. Memory allocators, ASLR (address space layout randomization), and hash map ordering all introduce randomness into your program’s runtime state. A buffer overflow that reads adjacent memory might read a zero most of the time and a non-zero value occasionally, depending on what happened to be allocated next door.
Hash maps are a particularly good source of this. In Python, Java, and many other languages, hash map iteration order is not guaranteed (and in Python was deliberately randomized starting in Python 3.3 for security reasons). Code that accidentally depended on a consistent iteration order would work fine most of the time, then produce subtly wrong results on certain runs or certain inputs.
If you’re chasing a bug that appears intermittently with no obvious timing or concurrency angle, look at whether your code has any implicit ordering assumptions. Sort your data before iterating if order matters. Be explicit about ordering guarantees. Distributed systems fail in exactly these same silent ways because they compound non-determinism across multiple machines.
6. The Correct Toolchain for Heisenbugs
Traditional step-through debugging is the wrong tool for this class of problem. Here’s what actually works:
Deterministic record-and-replay. Tools like Mozilla’s rr (for Linux) record an entire execution, including all non-determinism, and let you replay it perfectly, backwards if needed. You capture the bug in production, replay it locally. The timing is frozen. The bug is reproducible. This is the single highest-leverage tool for timing-dependent bugs that most teams aren’t using.
Chaos and stress testing. Artificially vary thread scheduling with tools like sched_setaffinity, add random sleep intervals, run under high memory pressure. You’re trying to make the non-determinism deterministic enough to reproduce reliably.
Property-based testing. Instead of writing specific test cases, you describe the properties your code should satisfy and let a tool like QuickCheck or Hypothesis generate thousands of random inputs. These tools will find the edge cases your handwritten tests won’t. They’re particularly good at finding the specific input values that trigger state-dependent bugs.
Production observability, not debugging. The goal for Heisenbugs in production isn’t to attach a debugger; it’s to instrument your system so that when the bug occurs, you have a complete record of what happened. Distributed tracing, structured logs, and metrics that capture state transitions give you the evidence you need after the fact.
Heisenbugs are genuinely hard. They’re hard because they exploit the gap between the abstract model of your code you hold in your head and the physical reality of how computers execute it. The teams that catch them fastest aren’t the ones who debug harder; they’re the ones who invest in observability before the bug appears.