
The Confident Wrong Answer
Ask an experienced developer where their application is slow, and they’ll tell you with confidence. They’ll point to the nested loop, the regex parser, the ORM-generated query. They’ll have a theory. The theory will feel right.
It will usually be wrong.
This isn’t a knock on developers. It’s a well-documented cognitive pattern. We build mental models of our code as we write it, and those models are calibrated to what we understand, not to what actually takes time. The parts we struggled to write feel heavy. The parts that came easily feel fast. Neither perception is reliable.
Donald Knuth’s famous observation, that premature optimization is the root of all evil, is quoted constantly. The second half of that sentence gets dropped more often: “Yet we should not pass up our opportunities in that critical 3%.” The point wasn’t to avoid optimization. It was that finding the right 3% requires measurement.
Why Intuition Fails at Runtime
Modern hardware executes code in ways that bear almost no resemblance to how the source looks. A tight loop that looks expensive might execute in microseconds because the CPU’s branch predictor and L1 cache handle it perfectly. A single function call that looks trivial might take milliseconds because it triggers a cache miss, waits on a mutex, or crosses a process boundary.
Consider database access. A developer looks at their code and sees a one-line query. What actually happens: the ORM constructs a query string, a network round-trip goes to the database server, the query planner parses and plans the query (sometimes without using the index you added), rows are serialized, transmitted, and deserialized. If that line sits inside a loop over a list of user IDs, you’ve just turned one database call into N database calls. This is the classic N+1 query problem, and teams discover it in production constantly, because no one thought to measure.
The latency breakdown on a typical web request looks nothing like the code breakdown. Network waits, lock contention, and I/O dwarf CPU computation for most business applications. Yet developers default to optimizing CPU-bound code because that’s what they can read.
What a Profiler Actually Shows You
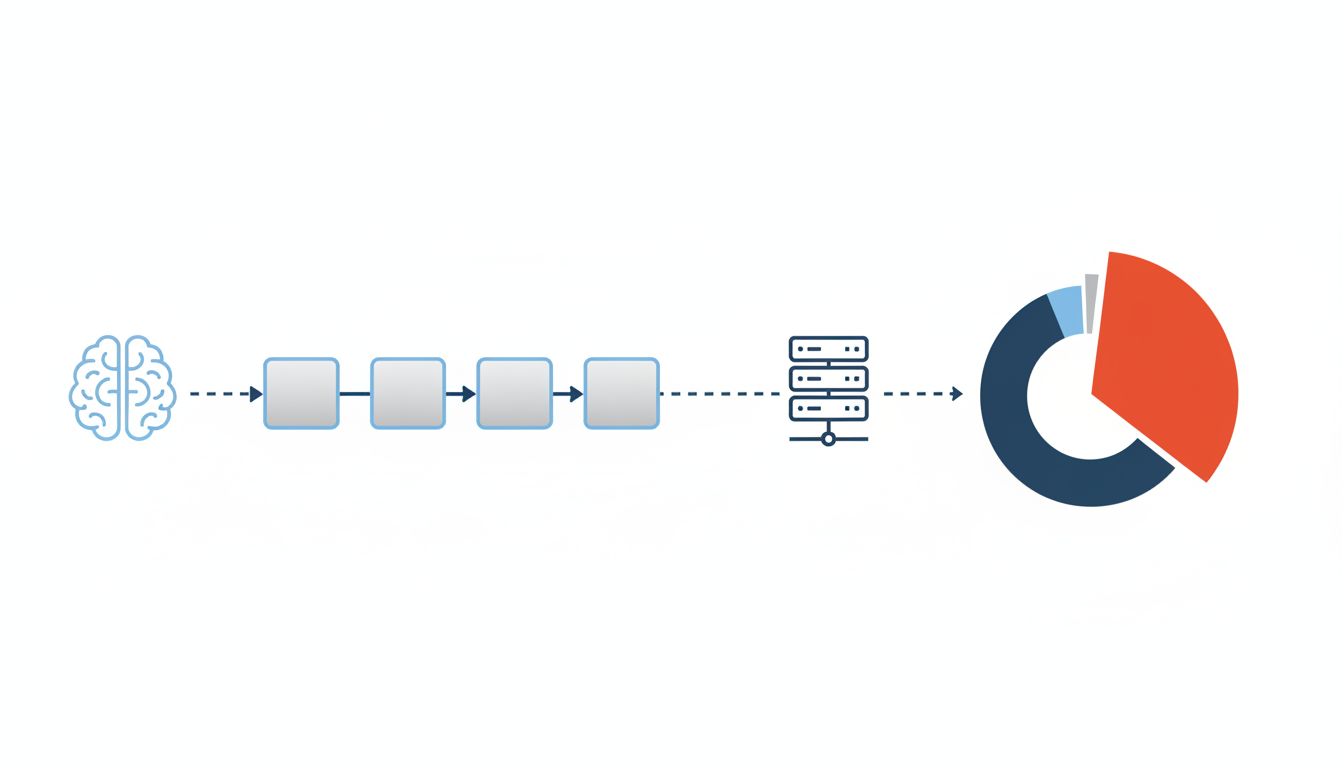
A profiler attaches to your running program and measures where time is actually being spent. The output is often humbling.
Sampling profilers (like Linux’s perf, or the built-in profilers in Chrome DevTools and Instruments on macOS) interrupt the program thousands of times per second and record what function is currently executing. Aggregate enough samples and you get a statistical picture of where your CPU time goes. Flame graphs, popularized by Brendan Gregg at Netflix, visualize this as stacked horizontal bars where width represents time. The wide bars are your actual bottlenecks.
Instrumentation profilers inject timing code around every function call, giving you precise counts and durations. They’re more accurate but introduce overhead that can distort results for tight loops.
The output frequently surprises even experienced teams. Common findings:
- The “slow” API endpoint is waiting almost entirely on a single database query that fetches more columns than it needs.
- A caching layer added to speed things up is itself a bottleneck because of lock contention at high concurrency.
- A logging call that looks like a no-op is actually serializing large objects to strings on every request.
- String concatenation in a loop is rebuilding a string from scratch on each iteration rather than using a buffer.
None of these are obvious from reading the code. All of them are immediately obvious from a profiler output.
The Amdahl Trap
Even when developers find a real hotspot, they often misunderstand how much fixing it will help. Amdahl’s Law states that the speedup from improving one component is limited by the fraction of time actually spent in that component.
If a bottleneck accounts for 10% of your program’s runtime and you eliminate it entirely, your program gets about 11% faster. That’s it. You’d need to find the thing that accounts for 60% of runtime, fix that, and then find the new thing that’s 60% of the remaining runtime. Optimization is iterative, and each iteration requires a fresh measurement, because fixing one bottleneck exposes the next one.
This is why teams that optimize by intuition tend to plateau. They fix the first obvious thing, the program gets a bit faster, they assume they’ve done the work, and then they stop measuring. The actual bottleneck, now unmasked, keeps grinding.
Real-World Lessons From Profiling in Production
The most valuable profiling happens against production traffic, not synthetic benchmarks. Production load has a different shape: different query patterns, different cache hit rates, different concurrency levels, and real user data distributions that your test suite almost certainly doesn’t cover.
Continuous profiling tools like Google’s Cloud Profiler, Datadog’s Continuous Profiler, and the open-source Parca agent run low-overhead sampling in production continuously, storing profiles over time. This lets you correlate performance changes with deployments, which is invaluable. You can literally see the flame graph widen in a specific function after a code change ships.
Google published research on their internal continuous profiling system showing that it routinely surfaces optimization opportunities worth single-digit percentage gains in CPU efficiency across fleet-wide workloads. At Google’s scale, a 1% CPU reduction is significant. At your scale, a 30% reduction in a key endpoint’s latency, the kind a profiler can find in an afternoon, is the difference between an acceptable product and a frustrating one.
The lesson isn’t that you need Google’s infrastructure. It’s that treating profiling as a one-time activity misses most of the value. Code changes constantly. Bottlenecks shift. What was fast six months ago might be slow today after a data volume change.
The Database Is Almost Always Involved
If there’s a single place where developer intuition most consistently fails, it’s database interactions. Developers see queries as instantaneous because they look instantaneous in code. The database sees them as full planning and execution cycles.
Two tools make this concrete. EXPLAIN ANALYZE in PostgreSQL (and equivalent commands in MySQL, SQL Server, and others) shows you exactly how the database executed your query: which indexes it used, how many rows it scanned, where it spent time. The difference between a sequential scan of a million rows and an index seek of 12 rows is not visible in your application code at all. It only shows up in the database’s execution plan.
Query logging with slow query thresholds is a blunt but effective complement. Set your database to log any query taking over 100 milliseconds. Review that log weekly. The patterns that emerge will consistently be queries that were written when the table had thousands of rows, running against tables that now have millions.
Missing indexes are the single most common and most fixable performance problem in production applications, and they’re almost never caught by looking at code.
What This Means
The practical takeaway is straightforward, even if acting on it requires some discipline.
Before you optimize anything, profile it. Pick up a profiler, run it against realistic load, and look at what the data says. The output will frequently contradict your expectations, and those contradictions are valuable. A flame graph showing 70% of your request time sitting in a single database call is actionable information. Your hunch about the regex was not.
Profile iteratively. After you fix a bottleneck, measure again. The second bottleneck is now exposed, and it’s probably different from what you expected before the first fix.
If you’re building a web application, add slow query logging to your database and leave it on. The marginal cost is negligible. The signal it produces is high value.
And take Knuth’s full point seriously. Premature optimization is a trap, yes, but so is optimization theater, the kind where a team spends two weeks tuning a function that accounts for 2% of runtime while their database logs pile up unread. Measurement is the thing that separates one from the other.
Your program is slow somewhere specific. A profiler will tell you where.