
The Illusion of Sequential Execution
The most important thing to understand about modern processors is that they are liars. Not maliciously, but architecturally. When you write code that reads a variable, adds two numbers, and stores a result, you picture those operations happening in that order, one at a time. The CPU executes something quite different.
This gap between the code you write and what actually runs explains a surprising range of real-world problems: race conditions that seem impossible, performance bottlenecks that don’t match your profiler output, and security vulnerabilities that emerge from hardware behavior no one anticipated. Spectre, the processor vulnerability disclosed in 2018, exploited CPU speculation logic to read memory that software had explicitly restricted. The attack surface wasn’t in the code. It was in the processor’s attempt to run that code faster.
Fetch, Decode, Execute: The Pipeline That Changes Everything
A CPU doesn’t grab an instruction, finish it completely, then move to the next one. It processes many instructions simultaneously through a pipeline, similar to an assembly line where different stations work on different cars at the same time.
A modern out-of-order processor like those in Apple’s M-series chips or Intel’s recent Core designs can have pipelines with a dozen or more stages. At any given moment, one instruction might be fetching operands from registers while another is being decoded, a third is waiting for memory, and a fourth is actually executing in an arithmetic unit. The processor tracks all of these in-flight instructions through a structure called the reorder buffer, which ensures that even if instructions complete out of order internally, the results appear to retire in the original program order.
The practical consequence is that a single core running at 3 GHz isn’t executing 3 billion sequential operations per second. Modern desktop processors can retire multiple instructions per clock cycle, a capability called superscalar execution. AMD and Intel have shipped chips capable of retiring four or more instructions per cycle for well over a decade. The raw clock speed number understates the actual throughput significantly.
Branch Prediction and the Cost of Being Wrong
Pipelines create a specific problem: what happens when the next instruction depends on a decision the processor hasn’t finished making yet?
Consider a simple conditional: if a value is greater than zero, do one thing; otherwise, do another. The processor needs to keep the pipeline full, which means it needs to start fetching and decoding the next instructions before it knows which branch of the conditional will actually execute. The answer is speculation. The processor guesses which branch will be taken, starts executing down that path, and if the guess is wrong, it has to discard all that speculative work and start over. This penalty, called a branch misprediction, can cost 15 to 20 clock cycles on modern hardware.
Branch predictors have become extraordinarily sophisticated. They track the history of previous branch outcomes, recognize patterns in loops, and achieve accuracy rates above 95% in many real workloads. But that remaining fraction of mispredictions accumulates. Tight inner loops with unpredictable conditionals are genuinely slower than loops without them, and this is one reason why sorting data before processing it can produce dramatic speedups even when the sort itself costs time.
Spectre exploited precisely this mechanism. By training the branch predictor to expect a certain path, then providing inputs that cause a misprediction, an attacker could force the CPU to speculatively execute instructions that accessed privileged memory. The results of that speculative execution were discarded, but the data left traces in the CPU’s cache that could be measured from unprivileged code.
The Memory Hierarchy Nobody Taught You to Think About
Instruction throughput is only half the story. The other half is data movement, and here the gap between programmer intuition and hardware reality is even wider.
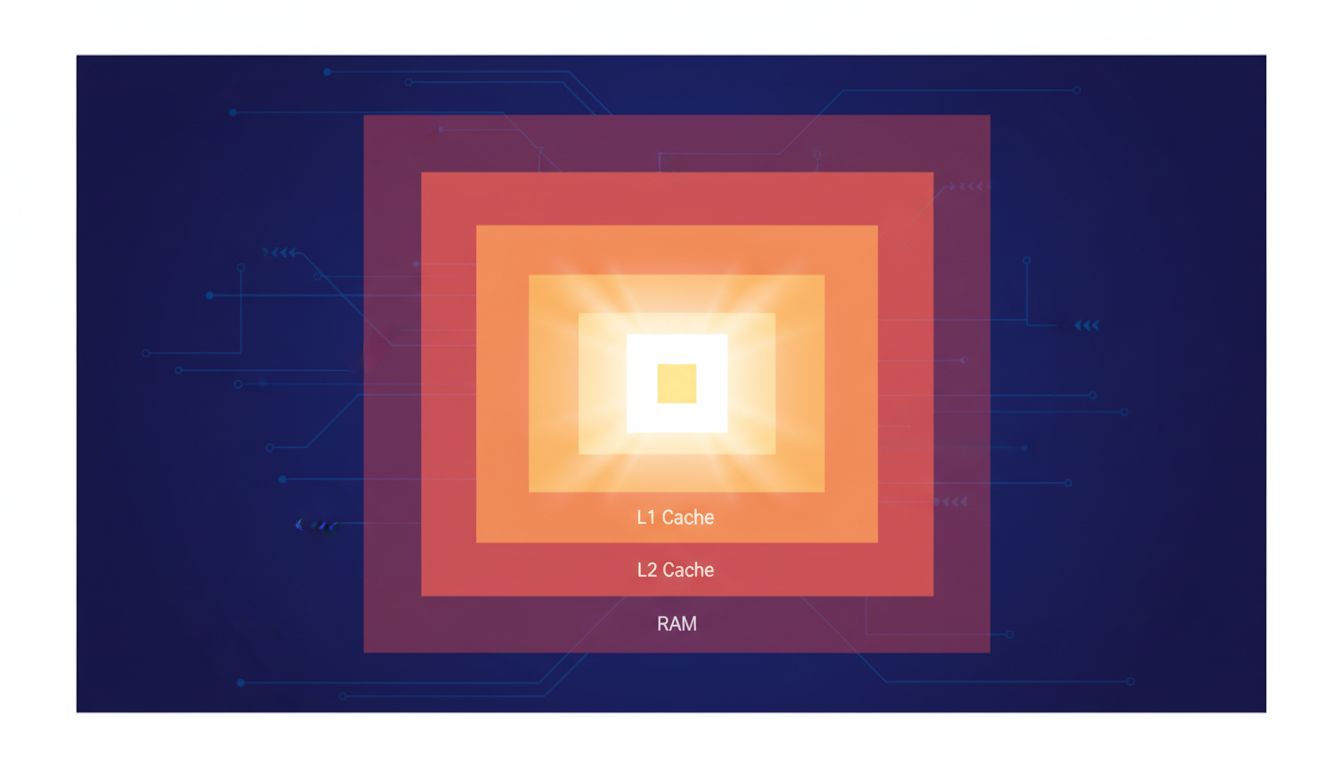
Modern CPUs don’t read data directly from RAM. They maintain a hierarchy of caches: L1 cache (typically 32-64KB per core) sits closest to the processor and delivers data in about 4 clock cycles. L2 cache is larger and slower, around 12 cycles. L3 cache, shared across cores, takes roughly 40 cycles. Main memory, when the data isn’t cached at all, can cost 200 or more cycles.
The processor handles this through prefetching, attempting to predict which data you’ll need before you explicitly request it. Sequential memory access is easy to predict and prefetch efficiently. Random access across a large data structure is not. This is why iterating over an array in order is often significantly faster than iterating over a linked list of the same size, even though both operations are O(n). The array benefits from hardware prefetching; the linked list, where each node pointer leads to an unpredictable location, does not.
This also partially explains why the performance characteristics of code can be so counterintuitive. You might optimize an algorithm to reduce the number of operations, only to find it runs slower because you changed the memory access pattern in a way that defeats the prefetcher. This is one of the places where readable code and simple code are not the same thing: the version that looks cleaner may interact with hardware in ways that create real costs.
Why This Matters for Software Engineers
Most programmers work at abstraction layers that deliberately hide all of this. That abstraction is usually the right trade-off. But there are specific situations where understanding the hardware changes how you write code.
Multithreaded programs on multi-core processors reveal a layer the pipeline story omits: each core has its own caches, and keeping those caches consistent with each other requires a protocol that introduces latency. Writing to a variable from one thread invalidates the cached copy on other cores. A program that has threads constantly writing to shared memory can spend more time maintaining cache coherence than doing actual work. False sharing, where two threads write to different variables that happen to share a cache line, can produce the same problem even when the threads never touch the same data.
The processor’s speculative and out-of-order behavior also creates memory ordering guarantees that differ from what most programmers assume. On x86 hardware, stores become visible to other cores in program order, but other architectures like ARM are more relaxed. Code that relies on an implicit ordering of memory operations can behave correctly on one processor family and fail silently on another. The bugs that appear only in production, on specific hardware, under specific load conditions, often trace back to assumptions about memory ordering that the hardware doesn’t actually provide. This is the kind of environment that produces heisenbugs that reveal the limits of deterministic thinking.
None of this means you need to write assembly or obsess over cache lines for routine application code. But when performance matters, or when a concurrent program behaves mysteriously, the explanation is usually somewhere in this machinery. The CPU isn’t executing your program. It’s executing a highly optimized approximation of your program that produces the same observable results. Most of the time.