The Profiler Shows Nothing. The User Sees 3 Seconds.
You’ve been here. The API response time in your logs says 45 milliseconds. The user’s browser records 3.1 seconds. You spend a week optimizing database queries. The user still waits 3 seconds. The profiler was telling the truth. You were just measuring the wrong thing.
This gap between what developers measure server-side and what users actually experience is one of the most persistent and expensive misunderstandings in software development. It’s not a tooling problem. It’s a mental model problem. Most engineers who’ve spent their careers writing code have a serviceable intuition for CPU and memory behavior. They have a deeply inaccurate intuition for what happens to a packet between two machines.
Fix the mental model first. The performance gains follow.
What “Network Time” Actually Includes
When an engineer says “network latency,” they usually mean the time a request spends in transit. That’s one component. The actual elapsed time from a user’s perspective includes TCP connection establishment, TLS handshake (if the connection is fresh), DNS resolution, time-to-first-byte after the request lands on the server, and finally the data transfer itself.
For a typical HTTPS API call over a new connection, the TLS handshake alone requires two round trips before a single byte of application data moves. On a connection between a user in São Paulo and a server in Northern Virginia, a single round trip takes roughly 130-150 milliseconds given physical distance and the speed of light through fiber. That handshake costs 260-300 milliseconds before your application code runs at all. Your 45ms server response time is now contributing about 12% of the total experience.
This is why latency numbers every engineer should know matter so concretely. They’re not trivia. They’re the fixed costs your application must pay on every cold connection, regardless of how efficient your backend is.
Connection Reuse Changes the Entire Calculation
HTTP keep-alive and HTTP/2 multiplexing exist precisely because connection establishment is expensive. When a connection is reused, the TCP and TLS costs are paid once and amortized across many requests. When it isn’t, those costs recur each time.
The problem is that many teams benchmark their APIs in conditions that never match production. They test with persistent connections in a local environment, see fast numbers, and ship. In production, mobile clients on cellular networks drop and re-establish connections constantly. CDN edge nodes negotiate new connections on cache misses. Third-party integrators don’t always implement connection pooling correctly.
HTTP/2 provides multiplexing, allowing multiple concurrent requests over a single connection. HTTP/3 goes further by running over QUIC instead of TCP, eliminating the head-of-line blocking problem that can cause a single dropped packet to stall an entire HTTP/2 connection. But upgrading your protocol doesn’t help if the clients calling your API haven’t upgraded theirs, or if an intermediate proxy is downgrading the connection.
The practical upshot: instrument what protocol version your clients are actually using. Many teams are surprised to find a significant portion of their production traffic is still HTTP/1.1, paying full connection-establishment costs on every request.
The Myth of the Single Hop
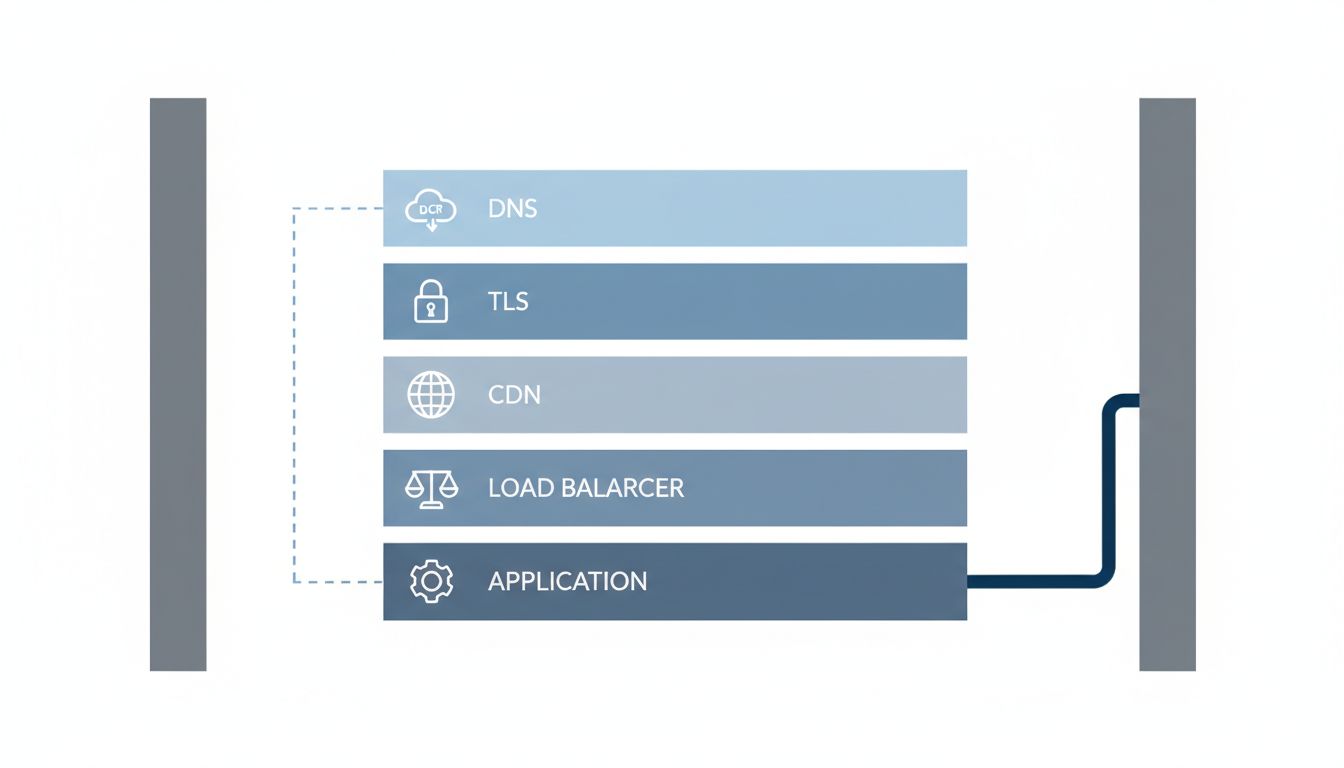
Developers tend to think of a network request as a point-to-point trip: client sends, server receives. In practice, a request from a consumer device to a production API often traverses a cellular base station, a carrier network, a backbone handoff, a load balancer, a WAF, a CDN edge node, an internal service mesh, and finally your application server. The return path may differ.
Each hop introduces queuing delay. Queuing delay is different from propagation delay (the speed-of-light component) and is far more variable. Under load, packets queue at routers and switches. That queue depth fluctuates with traffic patterns, creating the latency variance that shows up as unpredictable tail latency in production systems even when median response times look healthy.
This is why median latency is a misleading metric for user experience. A system with a 50ms median and a 2,000ms 99th percentile is not a fast system. It’s a system that makes roughly 1 in 100 requests miserable. At any meaningful scale, that 1 in 100 represents a large absolute number of users and often concentrates on your most active ones, since they make the most requests.
Measuring p95 and p99 latency gives you a far more honest picture of what your slowest users are experiencing, and those users are usually the ones your business depends on most. As the article on latency and throughput covers, optimizing for average performance is often optimizing for the wrong thing entirely.
Serialization and Payload Size Are Part of Network Performance
A request that leaves your server in 45ms carrying 2MB of JSON is a slow request. The payload size determines how long the transfer phase takes, and that transfer time scales with both bandwidth and latency in ways that surprise engineers who’ve only worked on high-speed internal networks.
JSON is verbose. A typical JSON response for a list of objects spends a significant fraction of its bytes on repeated field names. Protocol Buffers, MessagePack, and similar binary formats routinely reduce payload size by 60-80% for equivalent data, which translates directly to faster transfers over constrained connections. The tradeoff is debuggability and tooling support, which is a real cost worth taking seriously. But teams that dismiss binary formats without benchmarking are leaving measurable performance on the table.
Compression complicates this further. Gzip and Brotli compress JSON extremely well because of its repetitive structure, often achieving ratios that close the gap between JSON and binary formats. But compression consumes CPU at both ends, and on low-powered mobile devices, the decompression cost can exceed the transfer savings on small payloads. There is no universal answer here. The correct answer depends on your client profile, your payload sizes, and where your bottleneck actually is, which requires measurement.
Why Caching Fails in Ways That Look Like API Problems
Aggressive caching is one of the most effective ways to eliminate network round trips. It’s also one of the most frequently misconfigured layers in a production system, and when it fails, the symptoms look like API slowness.
HTTP caching semantics are genuinely complex. Cache-Control directives interact with Vary headers, with proxy behavior, and with client implementations in ways that produce unexpected cache misses. A misconfigured Vary header that includes Accept-Encoding can fragment a cache such that functionally identical requests each get a cache miss. An overly broad no-store directive can prevent caching at layers where caching would be most valuable.
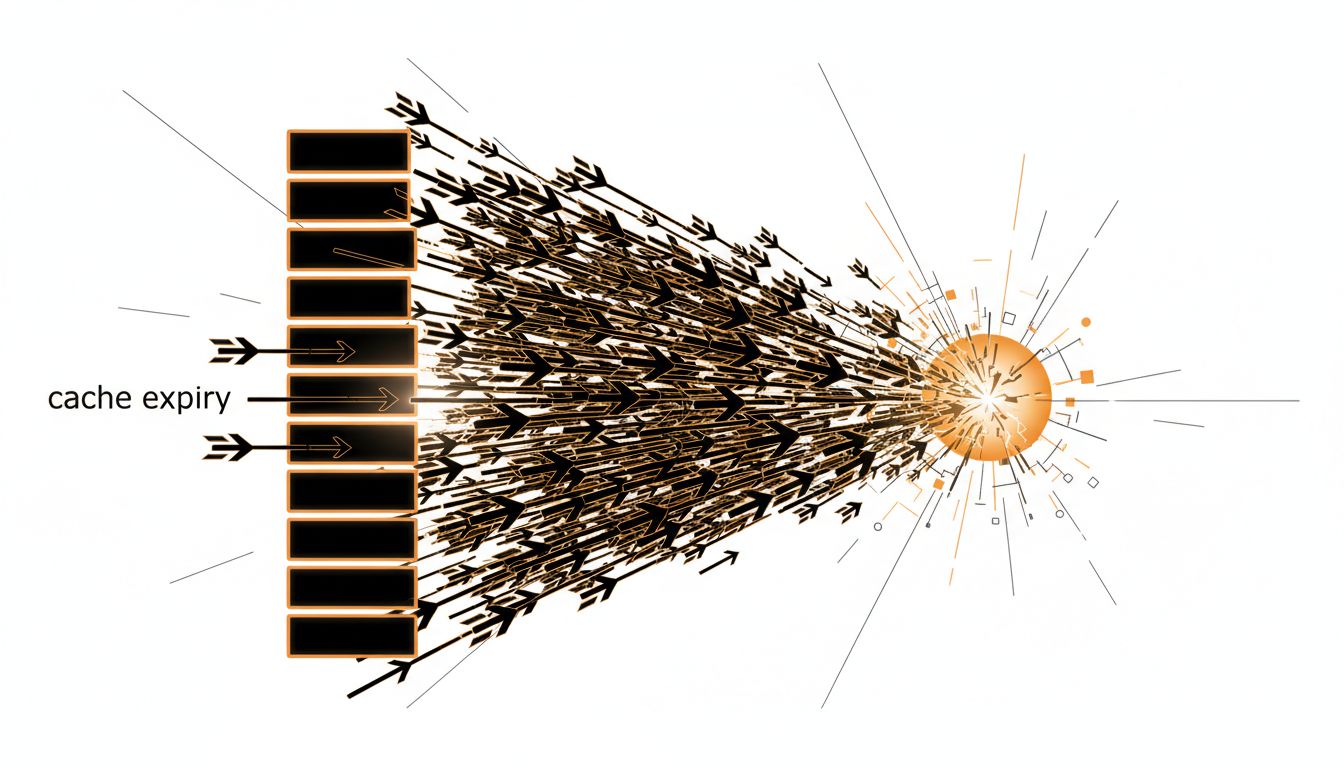
Beyond HTTP caching, application-level caches introduce their own failure modes. Cache stampede, where many simultaneous requests miss a cold cache and all hit the origin simultaneously, can make an API appear to collapse under load when the underlying service is perfectly healthy. Probabilistic early expiration (sometimes called PER or XFetch) is a technique that addresses stampede by allowing some fraction of near-expiry cache reads to refresh early, distributing the revalidation load. It’s not widely used, partly because it’s not obvious and partly because most teams don’t encounter stampede until it’s already causing an incident.
Building the Right Mental Model
The corrected mental model has a few key properties. First, treat connection establishment as a fixed cost that must be explicitly managed, not assumed away. Second, measure latency at the client, not at the server, because the server’s view of the world omits the most expensive parts of the user’s experience. Third, think of your p99 latency as the product’s performance, not a statistical outlier to be ignored.
Practically, this means instrumenting real user monitoring (RUM) data from client devices rather than relying entirely on server-side APM. It means testing API performance from geographically distributed locations that reflect your actual user base, not from the same data center where your servers live. It means auditing which protocol versions and compression schemes clients are using in production rather than assuming they match your development environment.
The engineers who make the most progress on API performance are usually not the ones who’ve written the most efficient code. They’re the ones who’ve developed an accurate picture of what the network is actually doing between their code and the user. Once that picture is clear, the right interventions become obvious. Before that, optimizing the wrong layer can actually obscure the real problem by making server-side metrics look better while user-facing experience stays flat.
What This Means
Server-side profiling measures the cheapest part of a request’s journey. For users on real networks with cold connections, the expensive parts happen outside your application code entirely. The gap between a 45ms server response and a 3-second user experience is filled with TCP handshakes, TLS negotiation, queuing at intermediate hops, and payload transfer time.
Optimizing an API without accounting for these costs is like tuning an engine to reduce friction while ignoring that the road has potholes. The right fixes (connection reuse, protocol selection, payload compression, correct caching configuration, geographic distribution of edge infrastructure) require understanding what the network actually does. That understanding isn’t complicated. It’s just rarely taught alongside the frameworks and languages that shape how most engineers think about performance.