The Simple Version
Different operations on a computer take wildly different amounts of time, and most engineers have no intuitive feel for the differences. Ignoring those differences is how you build systems that are slow for reasons you can’t explain.
The Numbers Themselves
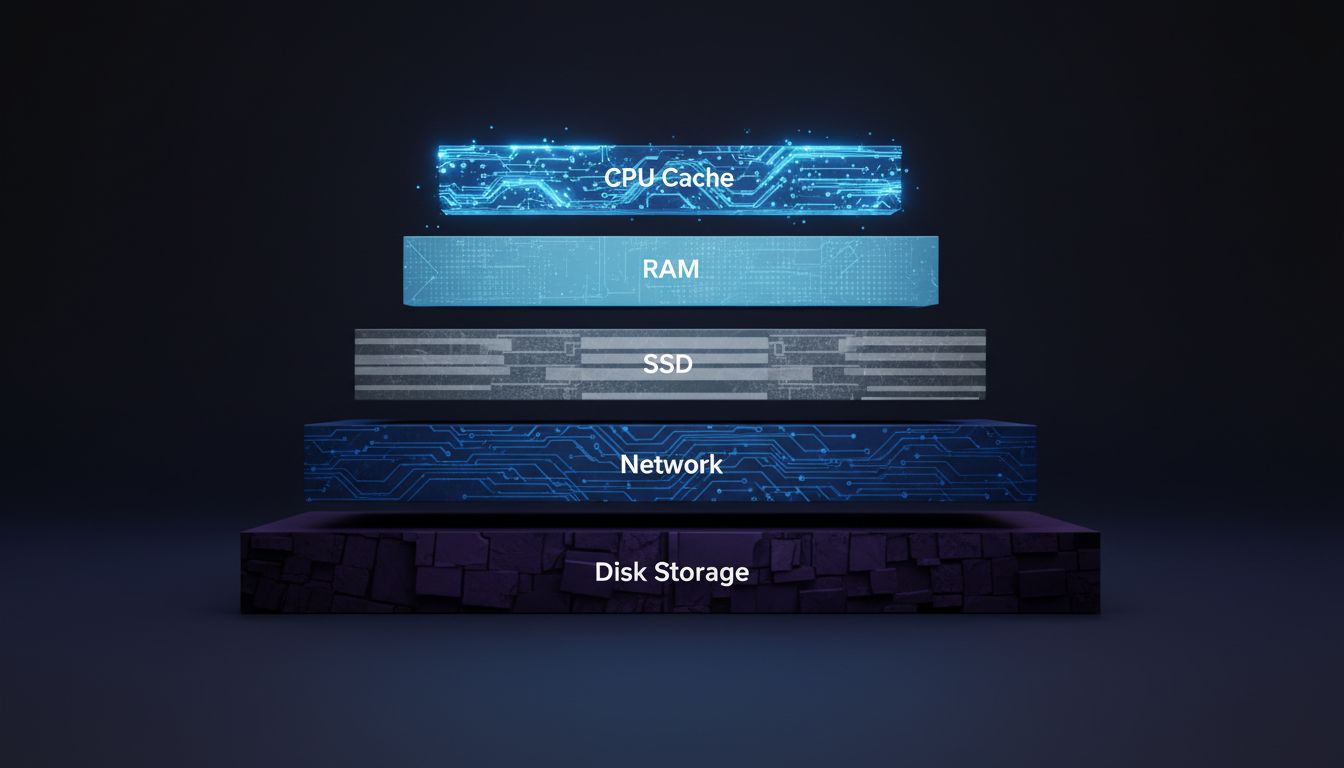
Jeff Dean, while at Google, popularized a table of latency numbers that became a kind of canonical reference for systems engineers. The specific values shift slightly as hardware improves, but the orders of magnitude stay remarkably stable. Here’s the rough shape of the hierarchy:
- L1 cache reference: ~1 nanosecond
- L2 cache reference: ~4 nanoseconds
- Main memory (RAM) read: ~100 nanoseconds
- SSD random read: ~100 microseconds (100,000 nanoseconds)
- Network round trip within same datacenter: ~500 microseconds
- Spinning disk seek: ~10 milliseconds
- Cross-continental network round trip: ~150 milliseconds
Notice the jumps. RAM is about 100x slower than L1 cache. An SSD is about 1,000x slower than RAM. A spinning disk seek is another 100x slower than that. A cross-continental network call is another 15x on top of that.
These aren’t small differences. They’re the difference between finishing a task in a microsecond and finishing it in a second.
Why Your Intuition Fails Here
The problem is that none of these units are human-scale. A nanosecond means nothing to a person. But here’s a frame that helps: if a single CPU clock cycle were one second, then reading from RAM would take about three minutes, and a network call across a datacenter would take about six days.
When you write a function that reads from a database inside a loop, you’re making thousands of six-day journeys in a row. The fact that it finishes in two seconds on your laptop doesn’t mean it’s fast. It means your test dataset is small.
This is the core trap. You write code that feels fast because the feedback loop in development is short. Then it hits production with real data volumes and collapses. The code didn’t change. The latency math caught up with you.
What Happens When You Ignore This
The most common failure mode is the N+1 query problem. You load a list of 500 users from a database, then for each user, make another database call to fetch their subscription status. That’s 501 queries instead of 1 or 2. If each query costs 1 millisecond, you’ve turned a half-second operation into a half-second one. At 10,000 users, you’re looking at 10 seconds. At 100,000 users, the page just times out.
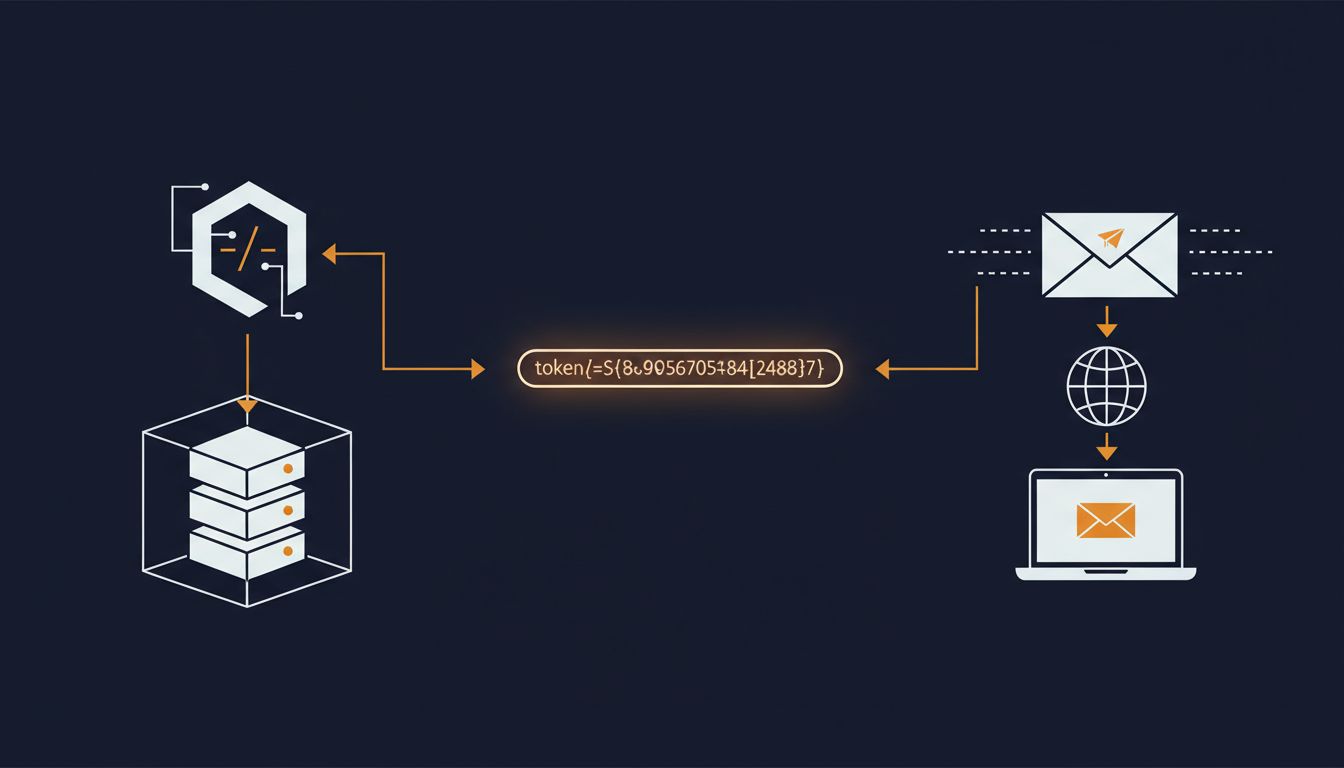
What makes this insidious is that ORMs (object-relational mappers, the tools that translate between your objects and database rows) make it trivially easy to write N+1 queries without realizing it. You’re calling what looks like a property access. Under the hood, it’s a network round trip.
A related failure is naively stacking microservices calls. Service A calls Service B calls Service C calls Service D. If each call adds 5ms of internal network latency, a four-layer chain adds 20ms before any real work happens. That sounds fine until you realize real systems often involve dozens of services, and that some of those calls happen inside loops. This is why some companies that adopted microservices aggressively in the early 2010s spent years afterward consolidating services back together. The architecture was logically clean and operationally slow.
Storage choice matters here too. Choosing between an SSD and a spinning disk, or between reading from memory versus disk, is a decision with a thousand-fold latency consequence. The second-cheapest cloud tier usually costs you more not just in dollars but sometimes in exactly this kind of hidden performance trade-off, where cheaper storage specs quietly make your reads an order of magnitude slower.
How to Build the Right Intuitions
The goal isn’t to memorize the table. It’s to internalize the shape of the hierarchy so your design instincts are calibrated.
Practically, that means a few things:
Batch your expensive operations. Instead of one database call per item, one call for all items. Instead of one API call per record, one call for a batch. This is almost always faster, and the gain is proportional to how expensive the operation is.
Push work closer to the data. A database query that filters and aggregates on the server is faster than one that dumps all the data to your application and filters it in memory, because you’re moving less data across a slow boundary.
Cache aggressively at the right layer. If reading from RAM is 1,000x faster than reading from disk, keeping frequently-read data in memory is one of the highest-leverage optimizations available. Memcached and Redis exist because this math is undeniable.
Measure before you optimize. The latency hierarchy tells you where to look, not what you’ll find. Profile first. Concurrent bugs hide in timing, not logic, and performance problems often hide in places your intuition says are fine.
The Bigger Point
Systems that feel fast and are fast are not the same thing. A system that handles 100 users can hide a tremendous amount of architectural debt. That debt gets collected when load increases, when data grows, or when you try to move from one region to a globally distributed deployment.
Engineers who have internalized latency numbers make different design decisions from the start. They ask, “how many times will this operation run, and at what cost?” before they write the code. They treat a network call inside a tight loop the way a careful driver treats a yellow light, as a reason to pause, not something to barrel through.
The numbers aren’t magic. They’re a translation layer between the abstract model of code and the physical reality of electrons moving through silicon and light moving through fiber. Getting that translation right is most of what distinguishes a system that scales from one that doesn’t.