
The Usual Suspect Gets Too Much Attention
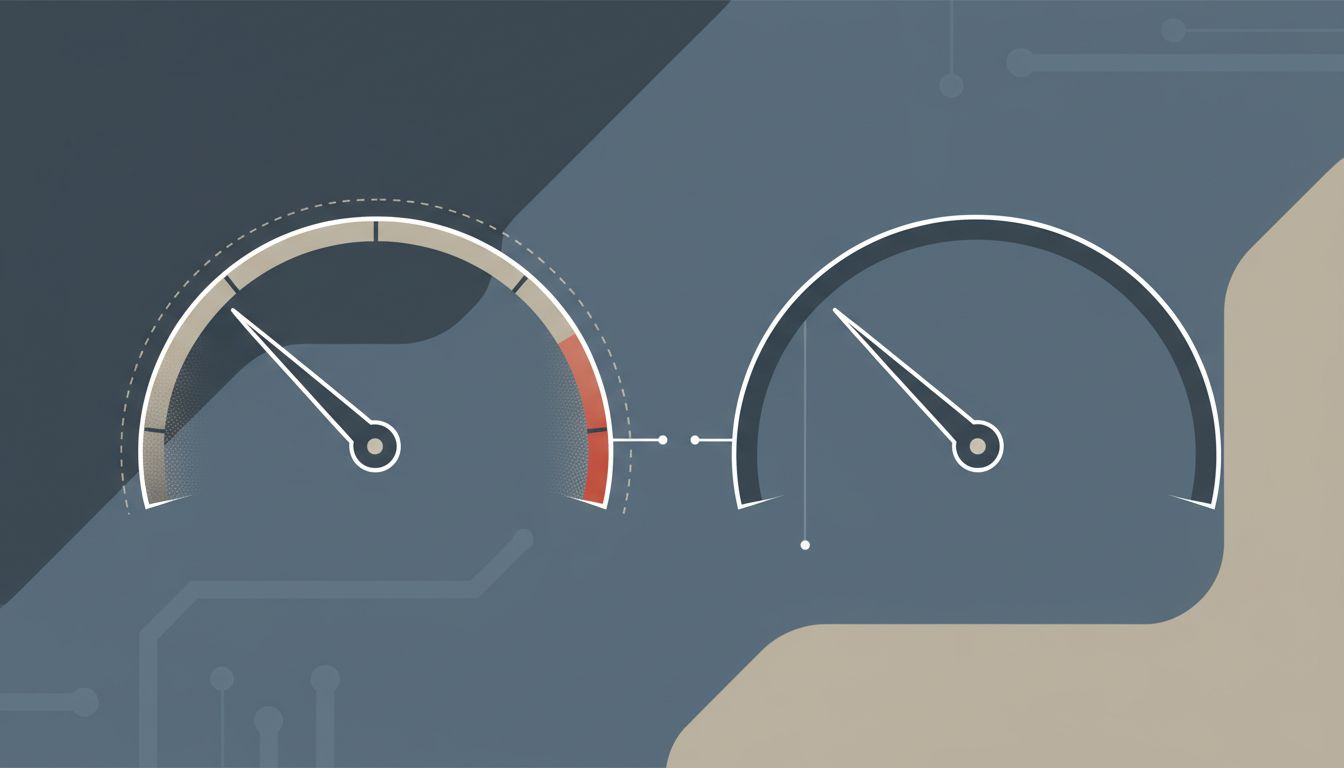
When a system slows down or falls over, the load balancer is often the first thing engineers point at. It sits at the front of the stack, it’s visible, and it touches every request. It feels like the right place to look. It almost never is.
Load balancers, whether you’re running HAProxy, NGINX, AWS ALB, or any of the major cloud alternatives, are extraordinarily good at their core job. They are purpose-built to handle millions of connections with minimal overhead. A well-configured HAProxy instance on modest hardware can handle hundreds of thousands of requests per second. The software has had decades of optimization poured into it. The bottleneck you’re hunting almost certainly lives somewhere else in your stack.
This matters because where you focus your attention during an incident shapes what you fix. Engineers who waste hours tuning round-robin weights and connection timeouts while their Postgres query planner is doing sequential scans on a million-row table are not just losing time. They’re building a mental model of their system that is actively wrong.
What’s Actually Choking Your System
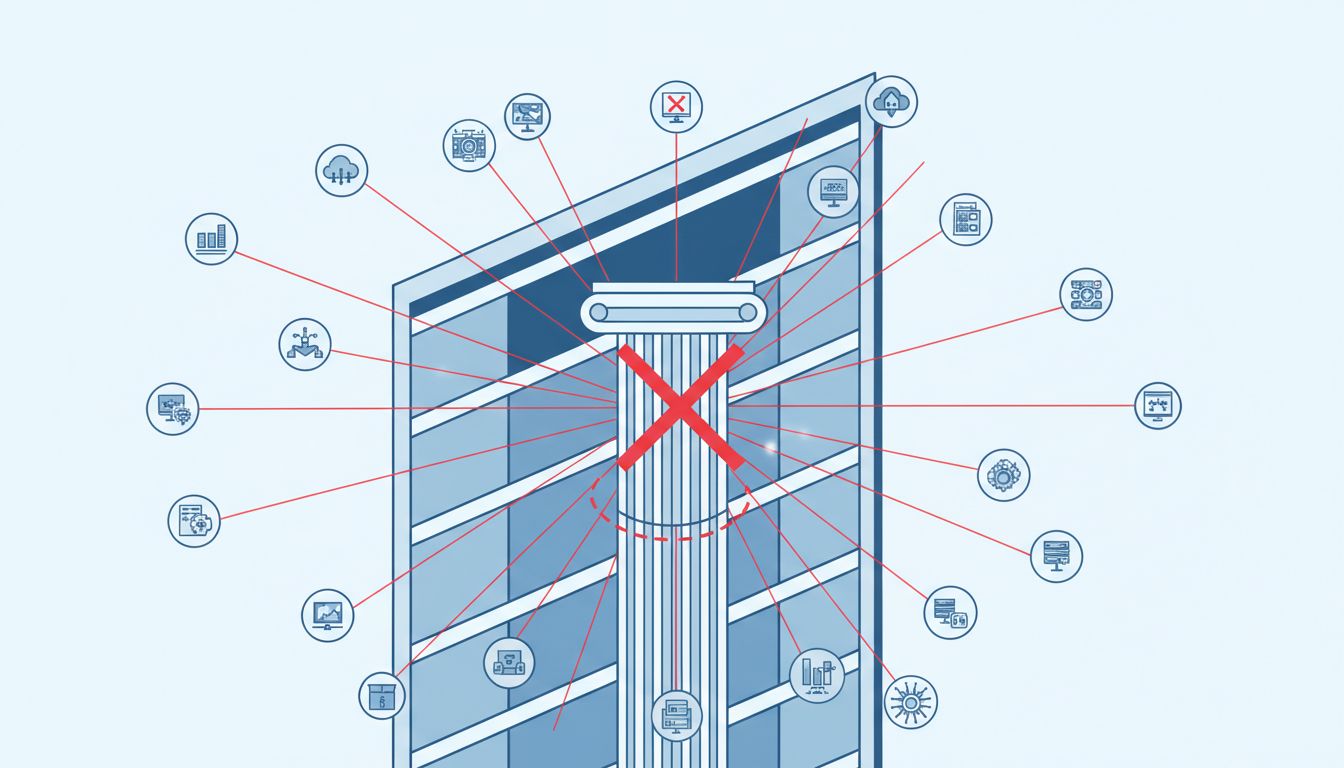
The real bottlenecks tend to cluster in predictable places, and none of them are the load balancer.
Database connections are the most common culprit. Most web applications open far more database connections than their database can efficiently serve. PostgreSQL, for instance, uses one OS process per connection. At a few hundred connections, context-switching overhead becomes measurable. At a few thousand, the database is spending more time managing connections than executing queries. PgBouncer exists specifically to solve this problem, and the number of production systems running without a connection pooler in front of Postgres is genuinely alarming.
Application-level blocking is the second major category. A request that spends 200ms waiting for an external API call, 50ms waiting for a cache miss to resolve, and 30ms waiting on a mutex somewhere in your ORM is a 280ms request before any network or load balancer overhead enters the picture. The load balancer forwarded it in under a millisecond.
Garbage collection is underappreciated as a latency source, particularly in JVM-based systems and in Go applications under memory pressure. A stop-the-world GC pause of 200ms hits every in-flight request simultaneously. From the outside, this looks like intermittent slowness. Engineers sometimes blame network jitter or load balancer weirdness when the real answer is heap sizing.
The Seduction of the Observable Layer
There’s a psychological reason engineers over-index on load balancers: they’re instrumented beautifully. Cloud load balancers generate rich metrics. You can see request rates, error rates, latency percentiles, and connection counts in real time. Dashboards are satisfying. They give you something to look at and something to tune.
The actual bottleneck is often in a layer that produces fewer signals. A slow database query might not surface until you run EXPLAIN ANALYZE on it directly. A thread pool saturation problem might only appear in application-level metrics you haven’t set up yet. A memory leak that’s forcing frequent GC cycles requires profiling, not dashboard-watching.
This is the same dynamic as searching for your keys under the streetlight because that’s where the light is. The load balancer is the streetlight. It’s bright and easy to examine. The keys are in your connection pool configuration.
As your API isn’t slow, your mental model of networks is, the mental model problem is often the root cause. Engineers who haven’t internalized where latency actually accumulates will keep optimizing the wrong layers.
Where Latency Actually Accumulates
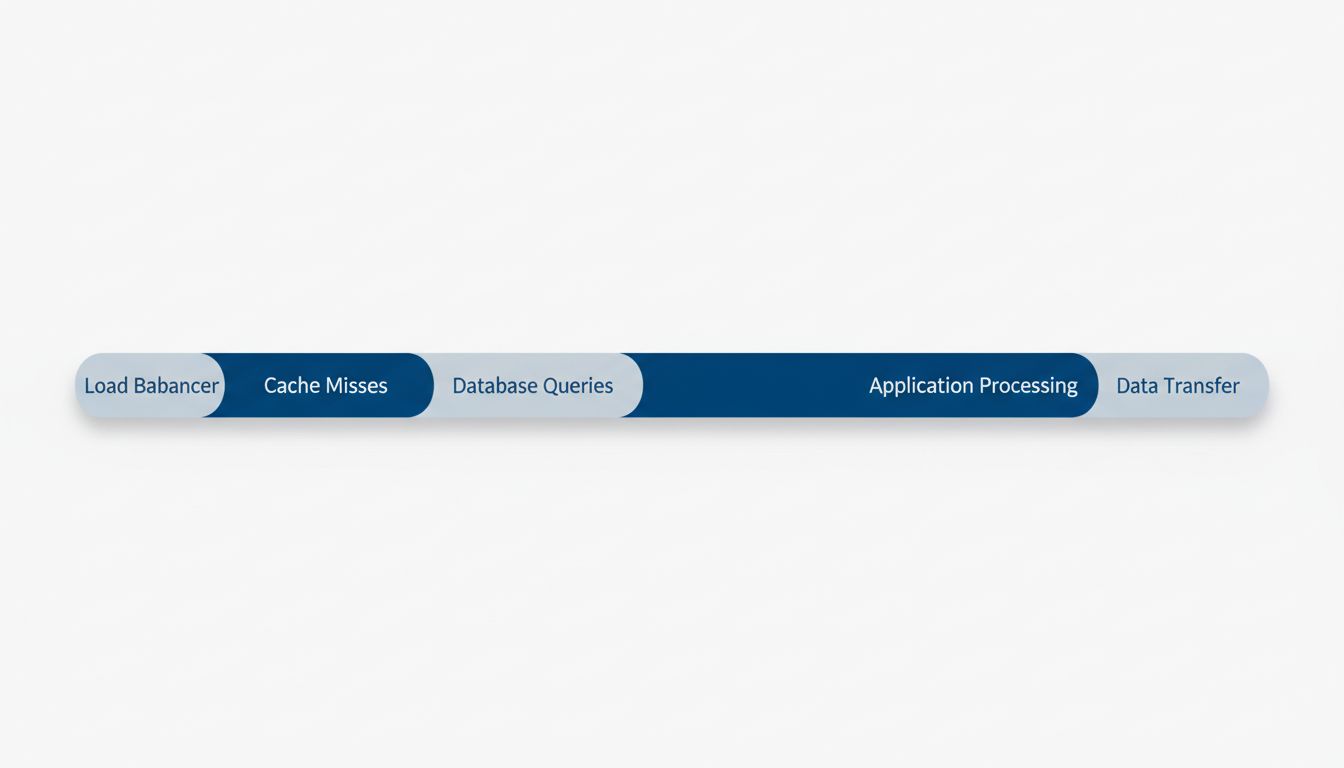
To be concrete: in a typical three-tier web application, a request moving from client to load balancer to application server to database and back picks up latency at several points. The load balancer’s contribution is measured in low single-digit milliseconds at worst. Often it’s sub-millisecond.
The database round-trip, including query execution, is typically 5-50ms for a well-indexed query, and can be hundreds of milliseconds for a poorly written one. An N+1 query problem, where your ORM fires one database query per item in a collection instead of joining at the database layer, can turn a single page load into dozens of sequential database round-trips. No amount of load balancer tuning addresses this.
Network latency between your application servers and your database matters more than most teams account for. If your application servers are in us-east-1 and you’re making 30 database calls per request, even 1ms of intra-region latency adds 30ms of overhead per request, unavoidably. This is a topology problem, not a load balancer problem.
Caching misses deserve separate attention. The difference between serving a response from an in-memory cache and going to disk is often two orders of magnitude in latency. A cache hit ratio of 90% sounds good until you realize that 10% miss rate on a high-traffic endpoint is generating substantial load. The fix is cache design and invalidation strategy, not load balancer configuration.
When the Load Balancer Actually Is the Problem
Fairness demands acknowledging the cases where the load balancer genuinely contributes to problems.
SSL termination is CPU-intensive, and on very high-traffic systems running on underpowered load balancer instances, TLS handshake overhead can become real. This is why session resumption exists and why modern TLS implementations prioritize it. It’s also why many high-scale systems push SSL termination to dedicated hardware or purpose-built software.
Sticky sessions (session affinity) can create uneven load distribution. If you’re routing all requests from a particular user to the same application server, and some users are dramatically heavier than others, some servers will run hot while others sit idle. The load balancer is doing what you told it to do, but the configuration is causing the problem.
Health check configuration can cause false failovers. A health check that’s too aggressive will mark healthy servers as down during momentary hiccups, removing capacity at exactly the wrong time. A health check that’s too lenient will keep dead servers in rotation. Getting this calibration right matters.
But these are configuration problems, not capacity problems. They’re solved by understanding what the load balancer is actually doing, not by throwing more resources at it.
How to Actually Find Your Bottleneck
The methodology for finding real bottlenecks is more useful than any specific answer about where they tend to live.
Distributed tracing is the most important tool in this space. Systems like Jaeger, Zipkin, or the tracing integrations in Datadog and Honeycomb can show you exactly how time is distributed across a request’s lifecycle. When you can see that 240ms of a 280ms request is spent waiting on database queries, the next step is obvious. Without this visibility, you’re guessing.
Load testing with realistic traffic patterns surfaces bottlenecks under stress before users find them in production. Tools like k6 and Gatling let you script realistic user journeys rather than just hammering a single endpoint. The pattern of failures under load often reveals where the constraint lives. If your application servers start returning 500s at 1,000 concurrent users while your load balancer metrics look healthy, the load balancer is not your problem.
Profiling application code during realistic load is underused. Many engineers profile in development on a laptop, which surfaces different bottlenecks than a production workload under concurrency. Continuous profiling tools like Pyroscope or the profiling features in commercial APM products can show you what your code is actually spending time on in production.
Query analysis belongs in every engineer’s regular practice, not just during incidents. Databases accumulate slow queries over time as data volumes grow and query patterns change. A query that ran in 5ms with 10,000 rows might run in 800ms with 10 million rows if the query planner chooses a different execution strategy. Periodic review of slow query logs is unglamorous but effective.
What This Means
Load balancers are solved problems. They are reliable, fast, and well-documented. The engineers who built them have already done the hard optimization work. Your job is to configure them correctly and then focus your attention on the layers where complexity and unpredictability actually live.
The practical upshot: when you’re investigating latency or capacity problems, work from the inside out. Start with your database queries and connection pool sizing. Look at your application code for blocking operations and N+1 patterns. Check your caching strategy. Review your service-to-service call patterns. Look at garbage collection metrics if you’re on a managed runtime.
By the time you’ve exhausted those investigations, you will probably have found your actual bottleneck. If you somehow haven’t, then take a careful look at your load balancer configuration. But don’t start there. The path to faster systems runs through boring infrastructure hygiene, not through the component that’s already doing its job well.