
The name is the problem. “Load balancer” implies a simple traffic cop standing at the entrance of your infrastructure, counting requests and distributing them evenly across servers. That’s accurate the way “word processor” accurately describes what a modern laptop does. Technically true, practically misleading.
Modern load balancers, whether you’re using AWS Application Load Balancer, Cloudflare, Nginx, HAProxy, or Envoy, are doing security enforcement, authentication, traffic shaping, observability, and deployment orchestration. If you’re treating yours like a dumb router, you’re almost certainly paying for capabilities you’re not using.
The Security Work Happens Before Your Code Sees the Request
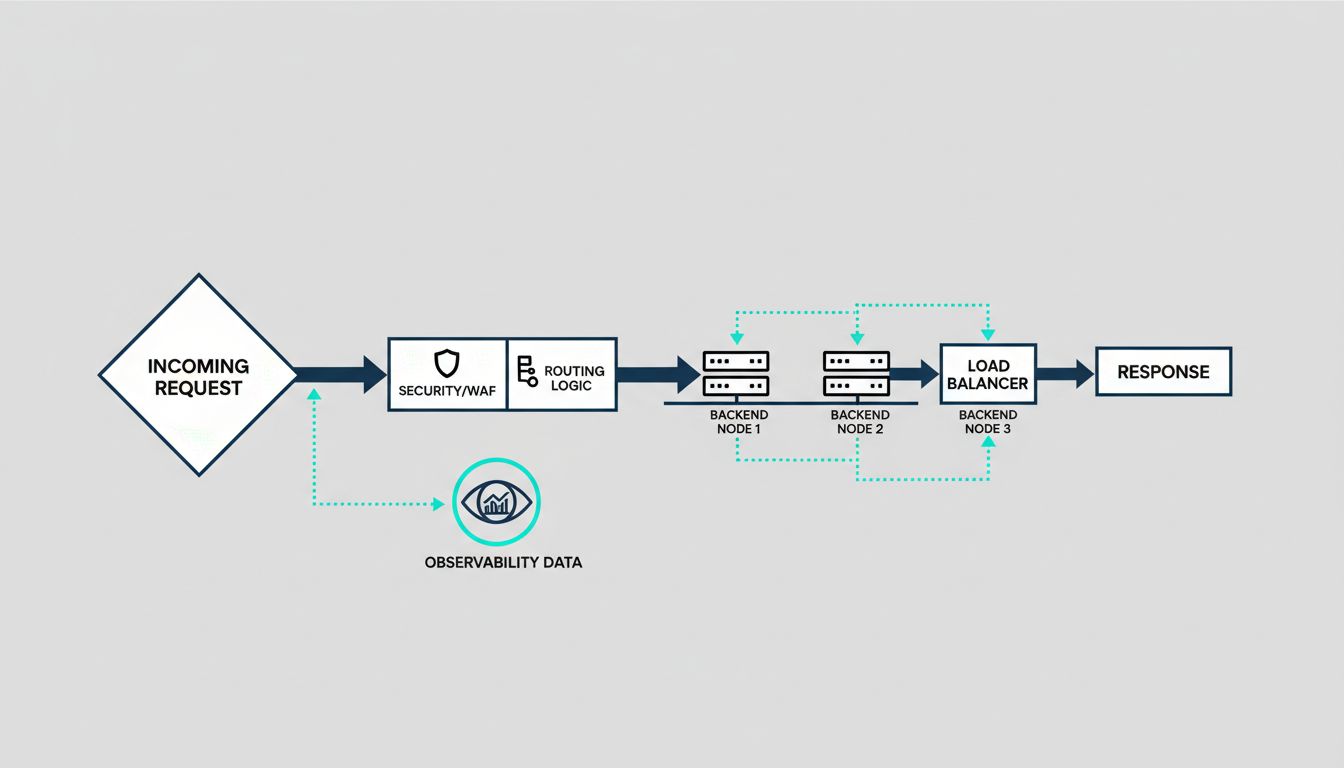
The most underappreciated function of a modern load balancer is how much attack surface it eliminates before traffic reaches your application. TLS termination is the obvious example: the balancer handles the cryptographic handshake, and your backend services communicate over plain HTTP on a private network. This means your application servers don’t need to hold private keys, and you can rotate certificates in one place rather than across a fleet.
But the security surface goes deeper. Application-layer load balancers can inspect HTTP headers, reject malformed requests, and enforce rate limits at the edge. AWS WAF, integrated with ALB, lets you write rules that block requests based on IP reputation, geographic origin, or request patterns that look like SQL injection and cross-site scripting. Cloudflare does the same at a global scale, absorbing volumetric DDoS traffic before it gets anywhere near your origin servers.
The practical consequence is that a well-configured load balancer is your first line of defense and your cheapest one. Blocking a bad request at the edge costs almost nothing. Letting it reach your application server, hit your database, and generate an error response costs compute time, logging overhead, and potentially a security incident.
Deployments Have Changed Because Load Balancers Changed
Blue-green deployments and canary releases both depend entirely on load balancer behavior. The idea behind both is the same: you shift traffic between versions rather than replacing code in place. Without a load balancer that supports weighted routing or target group swapping, you’re either doing risky in-place deployments or maintaining complex infrastructure to simulate the same behavior.
Kubernetes made this more visible. When a pod fails its readiness probe, the cluster removes it from the load balancer’s target pool. When a new deployment rolls out, pods are added incrementally. The rolling deployment that most teams take for granted is just a load balancer systematically adding and removing targets. The sophistication is in the orchestration, but the mechanism is traffic routing.
Service meshes like Istio and Linkerd extended this further by pushing load balancing into the sidecar proxies running next to every service. This enabled fine-grained traffic control at the service-to-service level, not just at the edge. You can route 5% of requests from Service A to the canary version of Service B based on a request header. That’s not load balancing in the traditional sense. That’s programmable traffic management.
Observability You Weren’t Paying For
Every request passing through a load balancer generates structured data: latency, status codes, request size, upstream response time, target health. This is some of the most valuable observability data in your system, and it arrives with no instrumentation cost. Your application doesn’t have to emit it. The balancer already knows.
ALB access logs tell you response time broken down into request processing time, target processing time, and response processing time. This matters when you’re debugging a latency spike. If your target processing time is high, the problem is in your application. If your request processing time is high, the problem is upstream. That distinction alone can cut hours off an incident investigation.
Nginx and HAProxy export detailed metrics that, when fed into Prometheus and visualized in Grafana, give you per-upstream health, connection pool saturation, and retry rates. The signal is there. Most teams just aren’t reading it systematically.
Health Checking Is Smarter Than It Looks
Passive health checking notices when a backend returns errors and routes around it. Active health checking probes backends on a schedule and removes them before they fail. The distinction matters more than most people realize.
A backend can be technically alive but degraded: returning 200s that take three seconds instead of 50 milliseconds, or serving stale data because its cache warmed incorrectly. Sophisticated health checks can test for this. HAProxy supports custom health check scripts. Envoy supports outlier detection, which automatically ejects endpoints that are statistically slower or more error-prone than their peers, even when they’re not technically failing.
This is where the mental model of “load balancer as traffic cop” breaks down entirely. Outlier detection is a feedback loop. The balancer is observing backend behavior over time and making autonomous routing decisions based on statistical inference. That’s not balancing load. That’s adaptive traffic management.
The Configuration You Set and Forget Is Costing You
The default configuration on most load balancers is a starting point, not a destination. Round-robin distribution ignores the fact that your backend servers may have different capacities. Least-connections algorithms do better when request processing time varies significantly. Consistent hashing matters when you have session affinity requirements or want to maximize cache hit rates on your backends.
Timeout configuration is where teams most commonly leave money on the table. If your load balancer timeout is longer than your backend timeout, the balancer will hold a connection open waiting for a response that your backend has already given up on. That’s a connection leak. If your backend timeout is longer than your load balancer timeout, backends will do work whose results never reach the client. Both scenarios are common in production and both are invisible until they cause incidents.
The load balancer sitting in front of your application is probably one of the most critical pieces of software you’ve never seriously examined. It handles every request you serve. Its configuration decisions affect your security posture, your deployment velocity, your incident response time, and your infrastructure cost. Treating it as a black box you set up once and ignore is a real liability. The teams that understand what their load balancer is actually doing have a systematic advantage over the ones that don’t.