
A for loop looks like three lines of code. Inside the CPU, it triggers a cascade of decisions, predictions, and physical electron movements that most programmers never think about. That gap between what you write and what the machine does is where performance lives.
1. Your Code Gets Translated Multiple Times Before Anything Executes
The for loop you write in Python, Java, or C is not what runs. The compiler or interpreter first converts it to an intermediate representation, then to assembly instructions, then to machine code (binary opcodes). A simple for (int i = 0; i < 1000; i++) in C might become a dozen or more assembly instructions: load the initial value into a register, compare, conditional jump, increment, jump back.
Each of those assembly instructions maps to a specific opcode that the CPU’s front end knows how to fetch and decode. The x86-64 instruction set has hundreds of opcodes. Your loop counter increment is likely an INC or ADD instruction. The loop condition check is a CMP. The jump back to the top of the loop is a JMP or JNZ (jump if not zero). This translation chain is why “write closer to the metal” advice is often overstated: a modern compiler will frequently produce tighter machine code than a programmer writing assembly by hand.
2. The CPU Doesn’t Execute Instructions One at a Time
Modern CPUs are pipelined, meaning they overlap the execution of multiple instructions. A simplified pipeline has four stages: fetch (load the instruction from memory), decode (figure out what it means), execute (do the actual operation), and write-back (store the result). While instruction N is executing, instruction N+1 is being decoded, and instruction N+2 is being fetched.
A typical modern processor has a pipeline depth of 14 to 20+ stages. Intel’s Skylake microarchitecture, for instance, has a 14-19 stage pipeline depending on how you count. This is why clock speed alone doesn’t tell you how fast a CPU is: a deeper pipeline can run at higher clock rates but is more sensitive to disruptions. Your loop is not running sequentially in any meaningful sense.
3. Branch Prediction Is What Makes Loops Fast (or Crushes Them)
The conditional jump at the end of your loop (jump back to the top if i < 1000) is a branch. The problem is that by the time the CPU finishes evaluating whether that condition is true, it has already fetched and partially decoded several subsequent instructions. If it guessed wrong about which path to take, it has to flush those instructions from the pipeline and start over. This is a branch misprediction penalty, typically 15 to 20 clock cycles on modern hardware.
For a regular for loop counting from 0 to 1000, the branch predictor gets it right almost every time. It sees a pattern: jump taken, jump taken, jump taken, jump not taken (once, at the end). Predictable. But write a loop where the condition depends on data (say, if (array[i] > threshold) inside the loop, where the values are random), and your misprediction rate climbs. This is why sorting data before processing it can make a loop dramatically faster, even though sorting adds work. A well-known Stack Overflow benchmark demonstrated exactly this: sorting an array before a conditional summation loop produced a roughly 5x speedup because the branch predictor could suddenly learn the pattern.
4. Memory Access Is the Real Bottleneck, Not Computation
Modern CPUs can execute arithmetic instructions in 1-4 clock cycles. Fetching data from RAM takes 100-300 cycles. Your loop’s actual speed is almost always determined by whether the data it touches is in cache, not by how many operations you’re doing.
CPUs have multiple levels of cache: L1 (typically 32-64KB, ~4 cycle access), L2 (256KB-1MB, ~12 cycles), L3 (several MB, ~40 cycles), and then main memory at 100+ cycles. A loop that iterates sequentially through an array gets a huge benefit from hardware prefetching: the CPU detects the sequential access pattern and loads future cache lines before you need them. A loop that accesses memory randomly (linked list traversal, hash table lookups) gets almost no prefetch benefit. This is one concrete reason array-based data structures outperform pointer-heavy ones even when the theoretical operation count is identical. It’s also why the fastest code is often the code that minimizes data movement, not the code with the cleverest algorithm.
5. Out-of-Order Execution Means Your Instructions Run in Whatever Order the CPU Wants
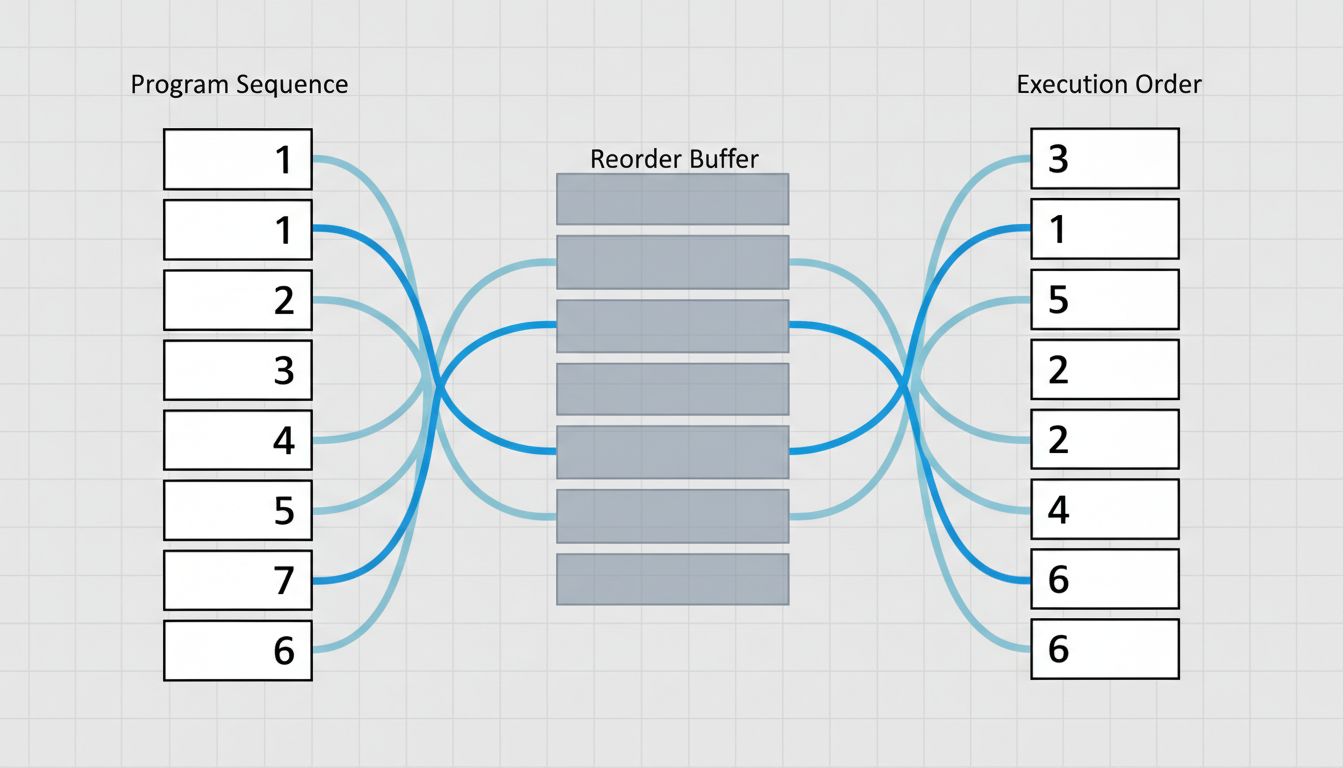
Modern superscalar CPUs don’t just pipeline instructions, they reorder them. If instruction 5 depends on the result of instruction 4 (a data dependency), but instruction 6 is independent of both, the CPU may execute instruction 6 before instruction 5 finishes. This is out-of-order execution, and it’s been standard since Intel’s Pentium Pro in 1995.
Inside the CPU, there’s a structure called the reorder buffer (ROB) that tracks which instructions are in flight and ensures results are committed in the correct program order, even if they executed out of order. A modern CPU might have 200-400 instruction slots in the ROB simultaneously. Your three-line for loop, at the machine level, is being broken into micro-operations (uops), scheduled across multiple execution units, and completed in a sequence that bears little resemblance to the order you wrote the code.
6. The CPU Is Also Making Decisions About Your Loop That You Never Asked For
Two optimizations happen largely without programmer involvement. First, SIMD (Single Instruction, Multiple Data): if your loop does the same arithmetic on a sequence of values, the compiler may auto-vectorize it, replacing scalar operations with AVX or SSE instructions that process 4, 8, or 16 values simultaneously. A loop adding two float arrays together can, with vectorization, run at roughly 1/8th the cycle count on a CPU with 256-bit AVX2 support.
Second, loop unrolling: the compiler may literally duplicate the loop body several times and reduce the number of iterations, cutting down on branch instructions and giving the out-of-order engine more independent work to schedule. GCC and Clang do both of these by default at optimization level -O2 or higher. The loop you wrote and the loop that runs can be structurally quite different. This is worth internalizing: profiling compiled code without looking at the assembly output gives you an incomplete picture of what’s actually happening.
The distance between source code and silicon is enormous, and most of it is occupied by layers of translation doing genuinely sophisticated work on your behalf. Understanding that machinery doesn’t make you write better for loops every day, but it does tell you exactly where to look when one of them is slow.