The Simple Version
When your browser or app fetches data from an API, that request often triggers a second, hidden fetch on the server side. You measure the first one. You forget about the second.
The Request Behind the Request
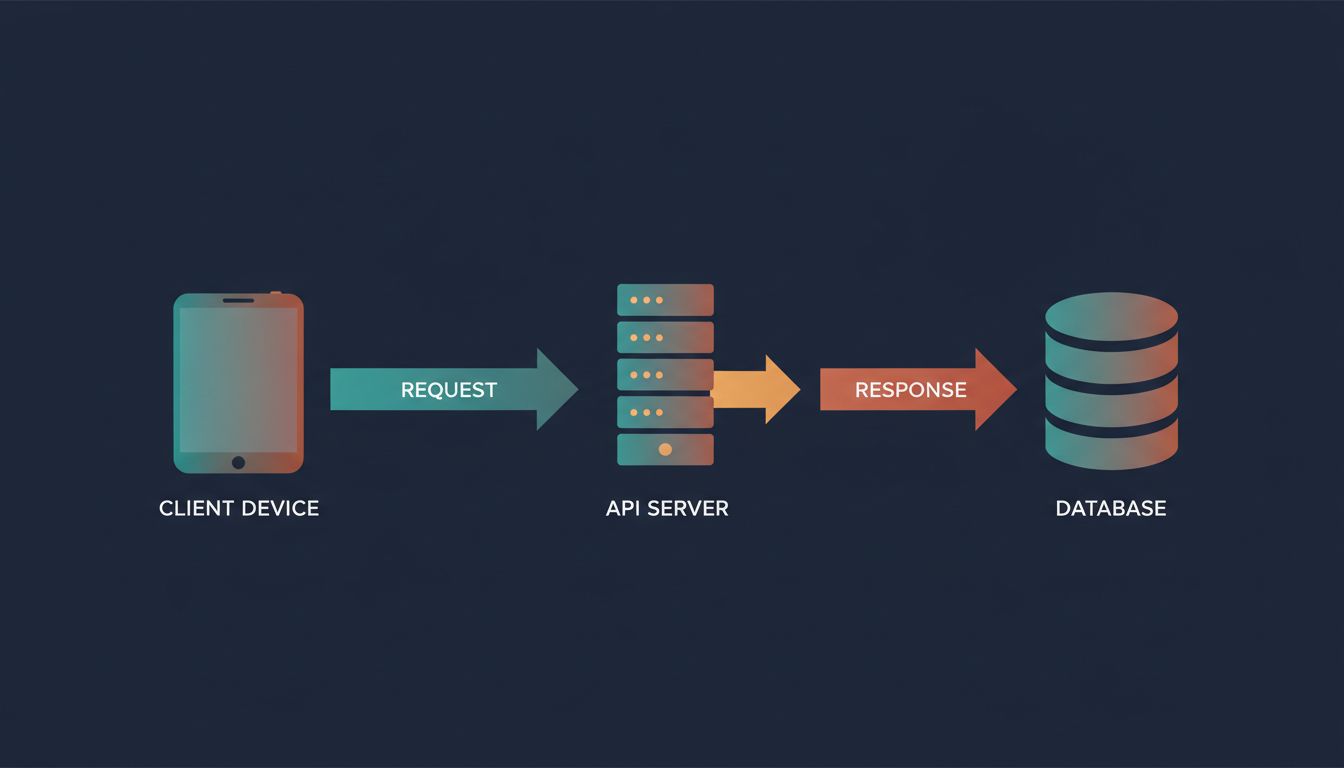
Here is what your monitoring dashboard shows: your API responds in 120 milliseconds. Here is what actually happens when a user loads your app.
The client sends a request to your API. Your API server receives it, then makes its own request to a database, a third-party service, or an internal microservice. That internal call takes 90 milliseconds. Your server processes the result and responds. The client receives the answer.
You measured 120ms total. You logged it as fast. But your user waited through two sequential network round-trips, plus compute time on both ends. The 120ms your server reported includes the database call, but it does not include the time your client spent waiting for the TCP connection to establish, for TLS to handshake, or for the response to travel back across the wire.
This is the gap between server-side latency and user-perceived latency, and it is almost always larger than developers expect.
What You Actually Miss When You Benchmark
Most API benchmarks measure from inside the server’s own perspective. Tools like Apache Bench or wrk send requests from a machine on the same local network, or even the same machine, and record how long the server takes to respond. This eliminates real-world variables: geographic distance, mobile network variability, DNS resolution time, and connection setup overhead.
DNS resolution alone can add 20 to 120 milliseconds on a cold lookup. A TLS 1.2 handshake requires two round-trips before a single byte of your actual response travels. On a connection with 50ms of latency, that handshake costs you 100ms before your API has said anything. TLS 1.3 reduced this to one round-trip, and HTTP/2 and HTTP/3 compound the improvement further, but only if your stack actually uses them end to end.
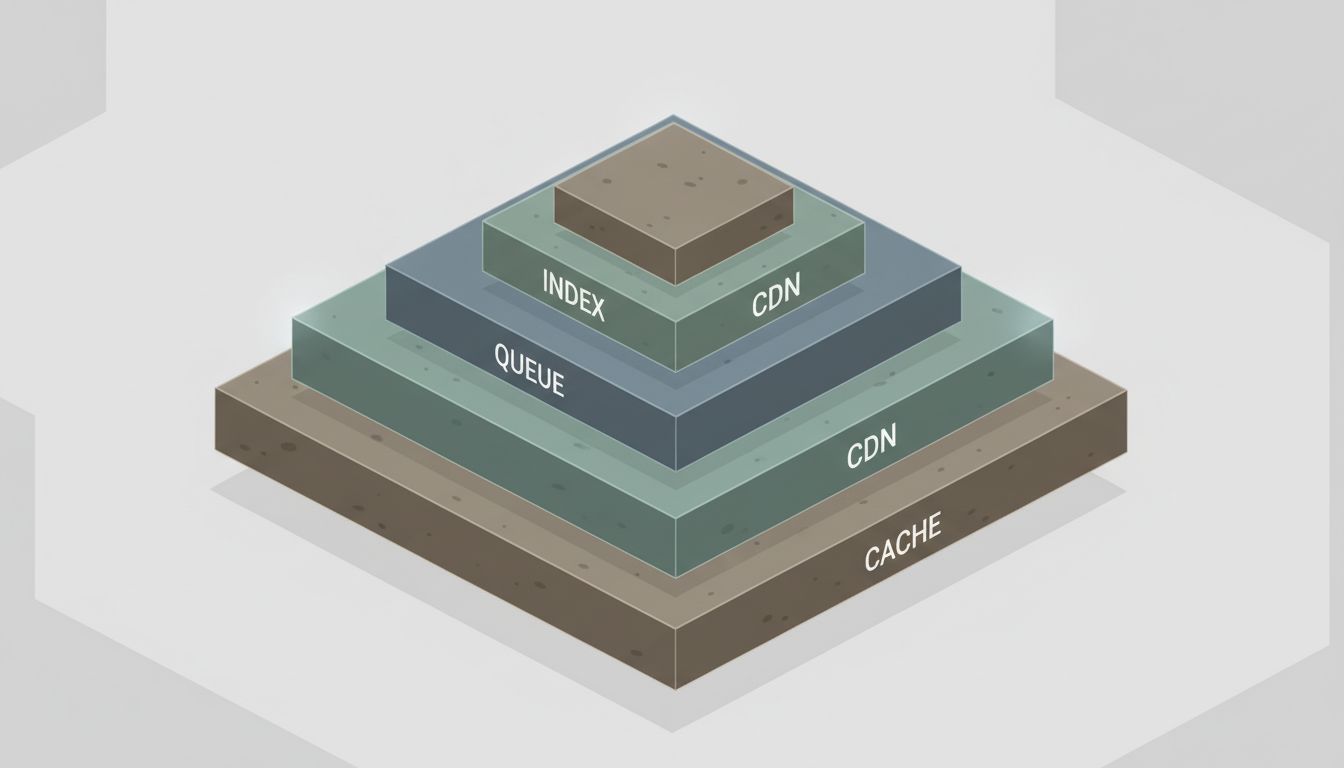
Then there is the server-side fan-out problem. Modern API architectures, particularly microservices, chain calls together. Your user-profile endpoint calls the auth service to validate the token. The auth service queries a Redis cache. On a miss, Redis queries the database. Each hop adds latency and adds a new failure surface. A cascade of four 30ms calls is not a 30ms API. It is a 120ms API, at minimum, and that is before accounting for retries.
This is also why rewriting in a faster language usually makes it slower: the bottleneck is rarely your compute. It is the network round-trips between services, and those do not get faster because your Go binary is leaner than your Python one.
The Database Call Is the Hidden Offender
If you look at the server-side fetch and trace where the time goes, one culprit shows up repeatedly: the database.
An API endpoint that looks fast in isolation often makes multiple database queries per request. The ORM fetches a user record, then separately fetches their associated records, then fetches related metadata. This is the N+1 query problem, and it is endemic. A page that displays 20 items might trigger 21 queries: one to get the list, then one per item to fetch related data. At 5ms per query, that is 105ms in database time alone, before network, before compute.
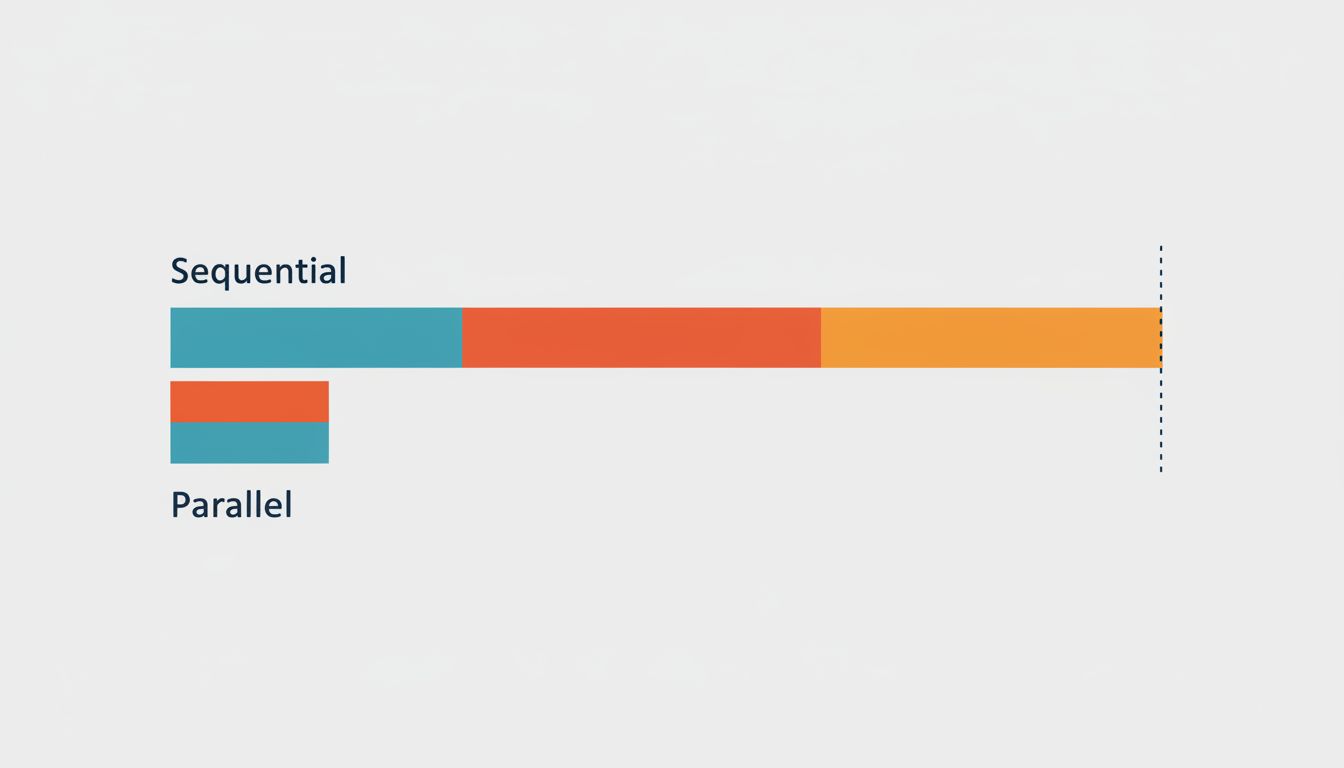
The subtler version is the sequential query. Even when you avoid N+1, queries that could run in parallel run in sequence because the code was written that way. Fetching a user’s profile and their notification count are independent operations. Running them sequentially doubles the wait. Running them concurrently, using Promise.all in JavaScript or asyncio.gather in Python, cuts that in half.
Caching helps, but it relocates the problem rather than eliminating it. A cache miss on a cold start or after an invalidation sends you back to the database. The relationship between connection overhead and query cost compounds this: the mechanics of how you maintain database connections affect whether a query that should be fast actually is.
The Frontend Pays the Full Bill
Your API team ships a 120ms endpoint. Your mobile team wraps it in a loading state. Your users see a spinner.
From the user’s perspective, the timer starts when they tap the button. It ends when the screen updates. Between those two events, the full cost of the network round-trip to your API server (including connection overhead), the server’s own latency (including any downstream calls it makes), and the client-side time to parse and render the response all accumulate.
On a mid-range Android device on a decent mobile network, the connection overhead alone can account for more of the perceived wait than your server-side processing. Techniques like connection pre-warming, keeping persistent connections open, and HTTP/2 multiplexing exist specifically to attack this layer. CDNs help by moving your server physically closer to the user, which cuts round-trip time at the speed of light.
The practical takeaway is that you need to measure from the client, not just the server. Tools like Chrome’s DevTools network panel, WebPageTest, or the Navigation Timing API give you the user’s actual experience, including all the overhead your server logs ignore. Real User Monitoring (RUM) takes this further by collecting timing data from actual users on actual devices and networks.
Fix the Measurement Before You Fix the Code
The instinct is to optimize the code when something feels slow. That is often the wrong first step. Before you touch the implementation, you need an accurate picture of where the time actually goes.
Instrument your API calls with distributed tracing (tools like Jaeger or Honeycomb make this approachable). Distributed tracing follows a single request across every service it touches and shows you a timeline of exactly where time was spent. Suddenly the 120ms endpoint reveals that 80ms of it was a single synchronous call to a payment validation service that could have been cached.
Once you see the real shape of your latency, the fixes become obvious. Parallelize independent calls. Cache results that do not change often. Move computation closer to the user where the data allows it. Cut round-trips by batching requests or using GraphQL to fetch exactly what the client needs in one call.
The benchmark that says your API is fast is not wrong. It is just measuring something other than what your users experience. Close that gap and you will find the actual slowness, which is almost never where you first looked.